This page was generated from docs/tutorials/easter/easter-snn-images.ipynb.
Interactive online version:
🐰 Easter with Rockpool 🥚
[1]:
# - Switch off warnings
import warnings

warnings.filterwarnings("ignore")

# - Imports
from rockpool import TSEvent, TSContinuous

import numpy as np
from tqdm.autonotebook import trange

try:
    from rich import print
except:
    pass

import jax
from jax import config

config.update("jax_enable_x64", True)

import matplotlib.pyplot as plt

%matplotlib inline
plt.rcParams["figure.figsize"] = [12, 4]
plt.rcParams["figure.dpi"] = 300
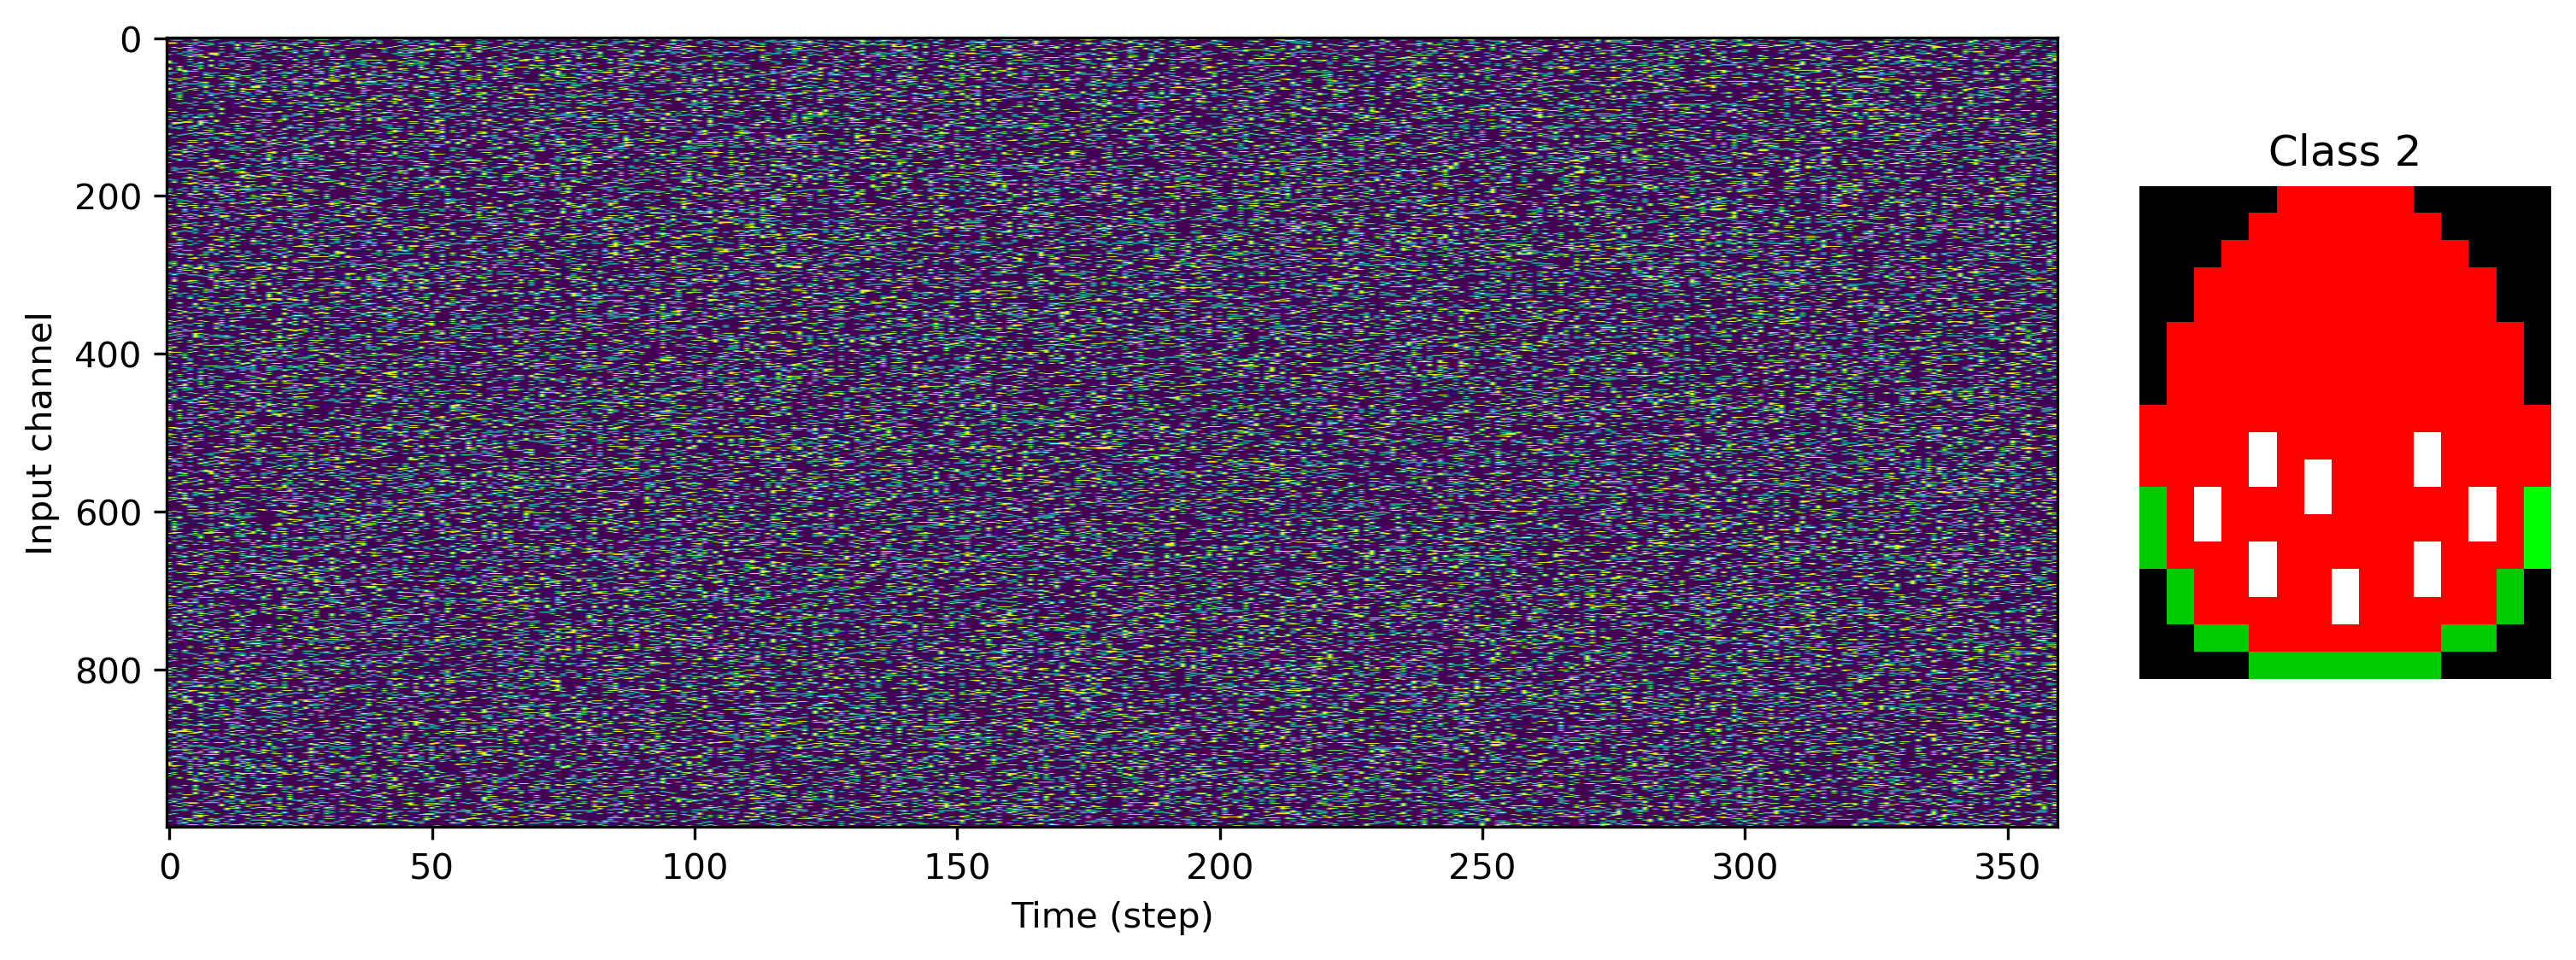
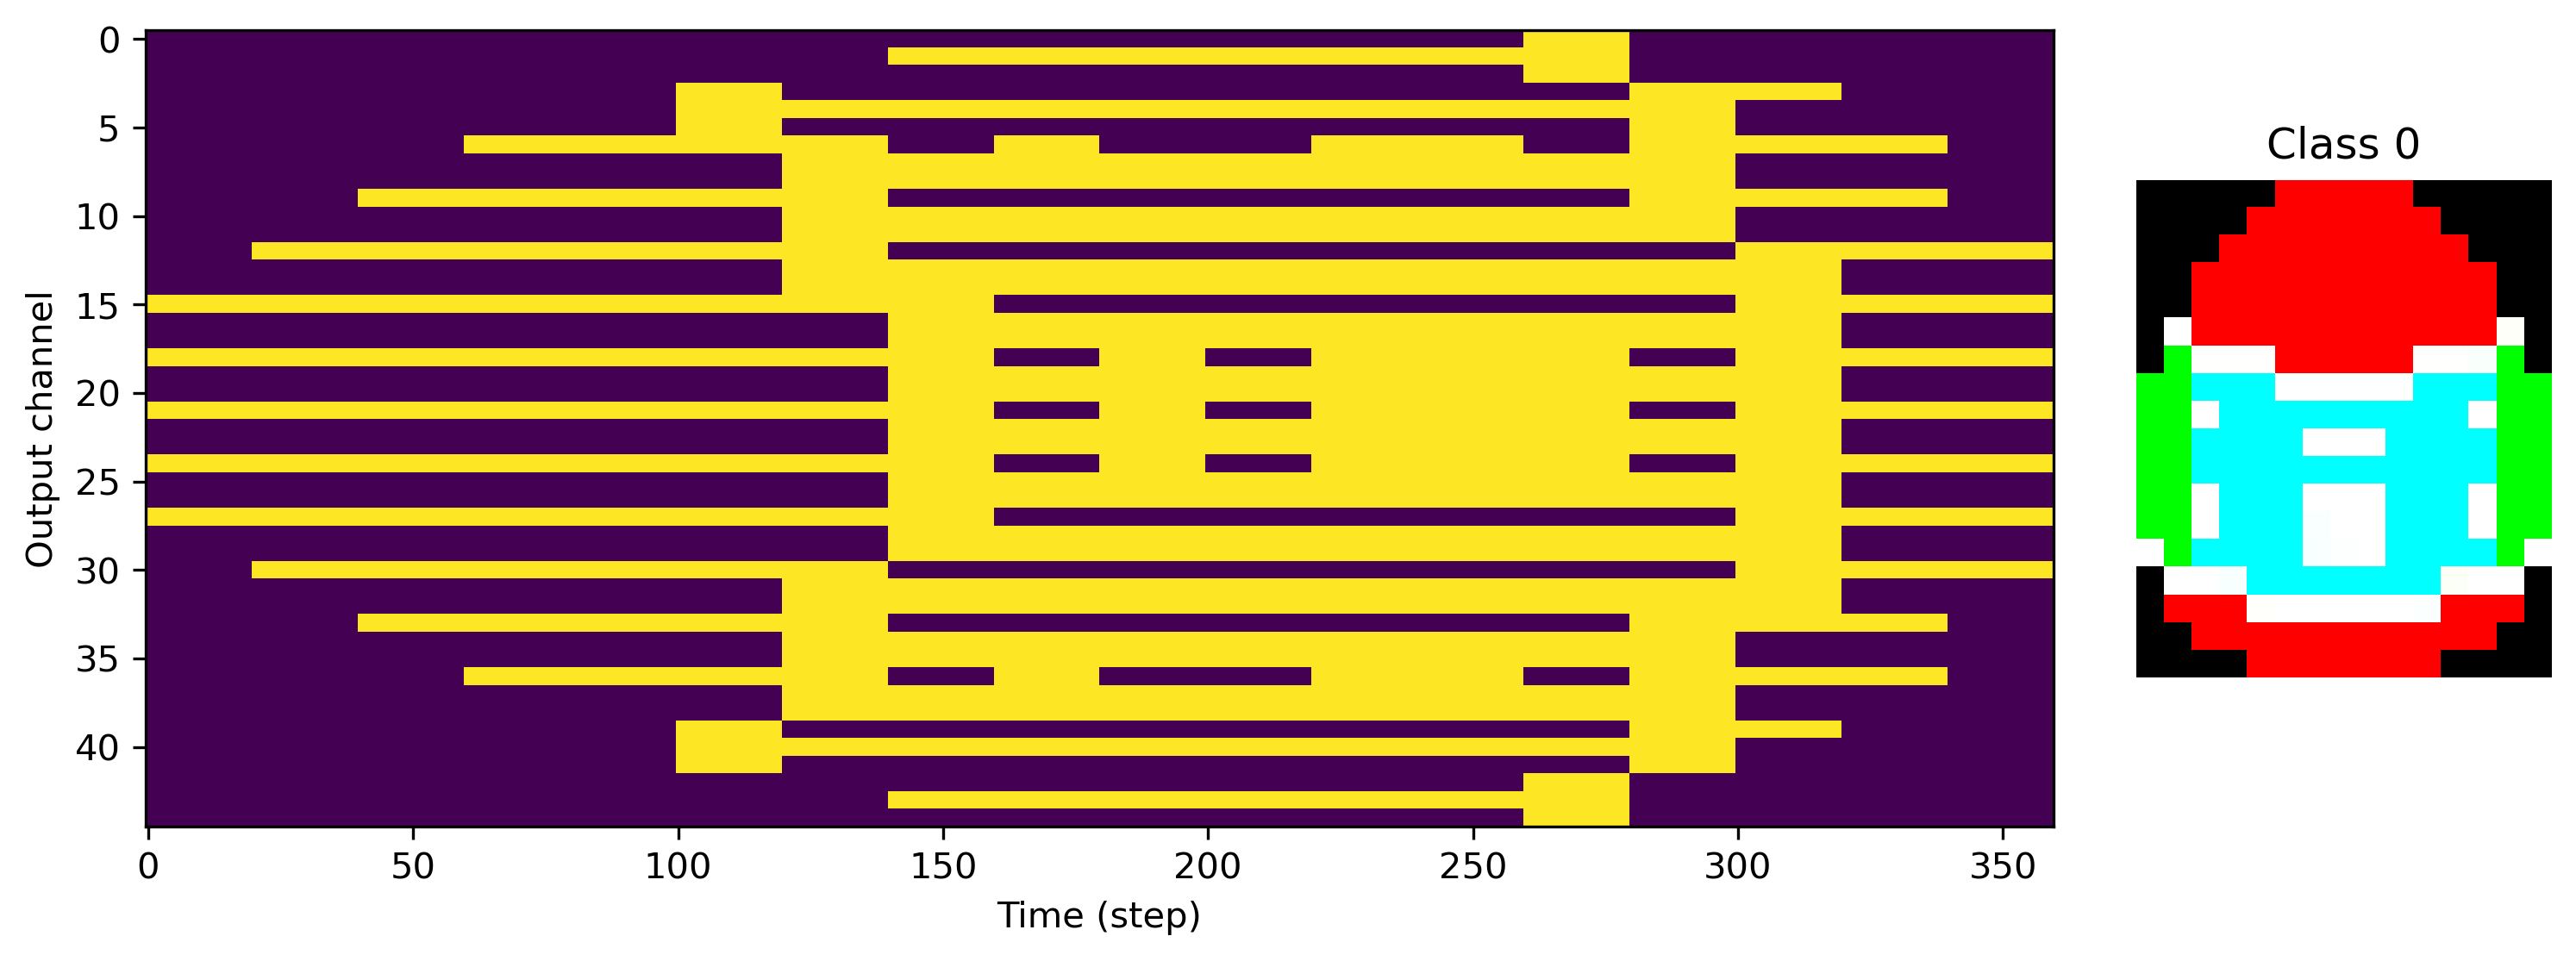
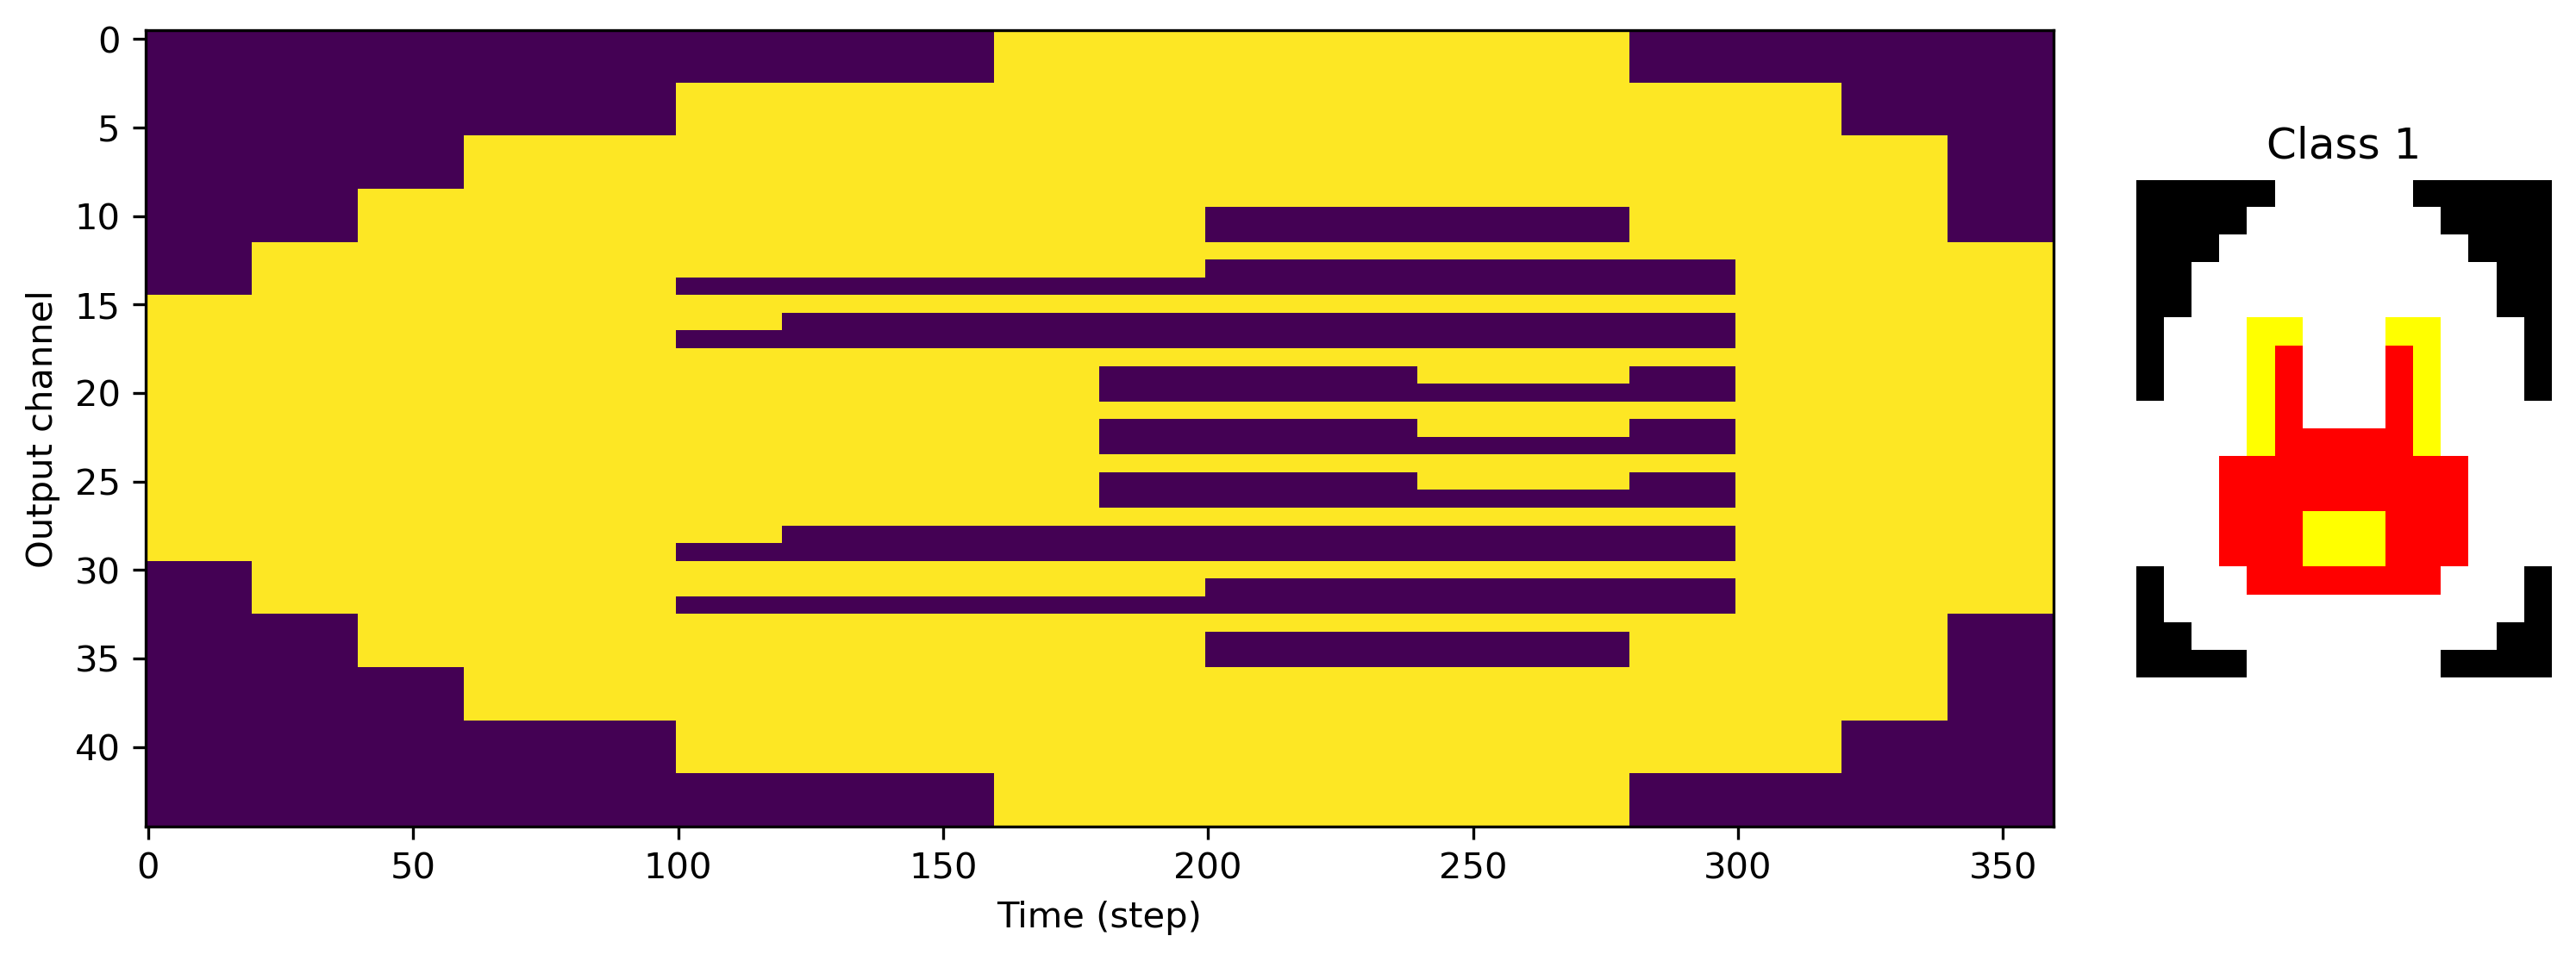
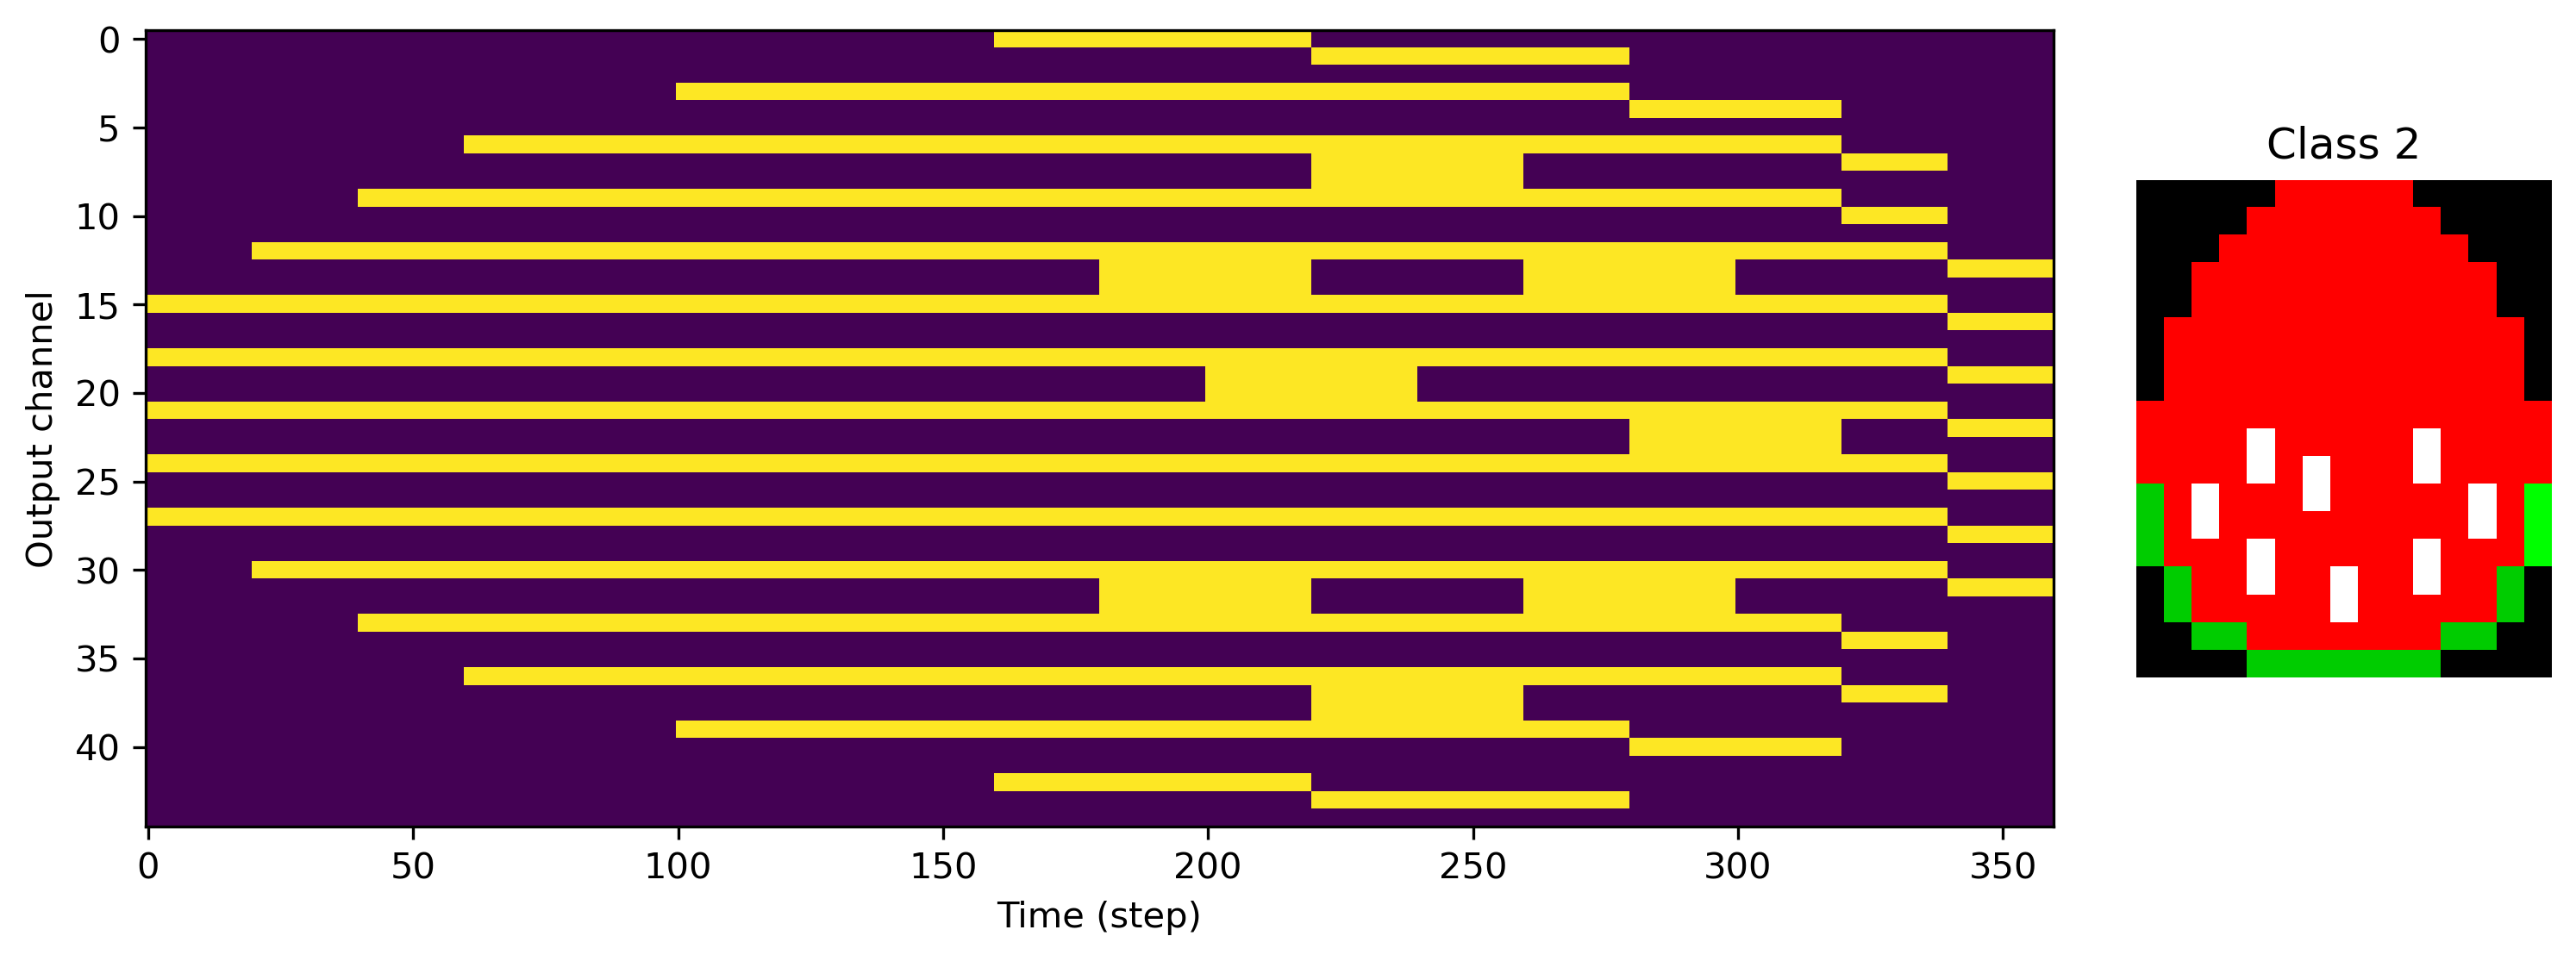
We’ll define a dataset class that encompasses the task of mapping frozen poisson inputs to RGB images. We’ll define a number of input channels to receive the poissonian noise; the output of the network will be several spiking neurons per pixel column, encoding the red, green and blue components of an image pixel. The images will be encoded by stretching them out across time, so that some number of time steps corresponds to a pixel row.
[2]:
from IPython.display import Image

Image("task.png")
[2]:
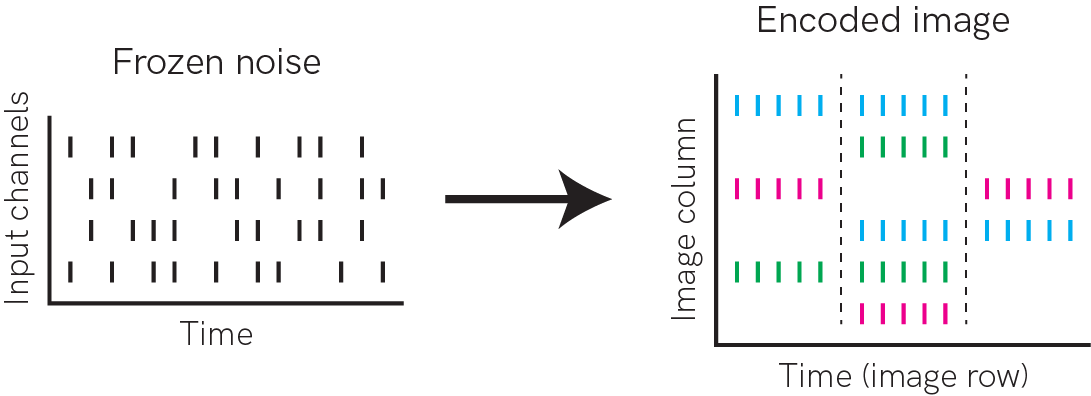
The dataset class will specify the task, and return samples for training and testing
[3]:
# - Dataset
class PoissonToImages:
    def __init__(
        self,
        filenames: str,
        num_input_channels: int,
        num_output_channels_per_pixel: int,
        time_steps_per_pixel: int = 20,
        poisson_rate=0.2,
    ):
        self.Nin = num_input_channels
        self.time_steps_per_pixel = time_steps_per_pixel
        self.num_output_channels_per_pixel = num_output_channels_per_pixel

        # - Read filenames in turn
        self.Nclasses = 0
        self.images = []
        for this_file in filenames:
            try:
                im = plt.imread(this_file)
                self.images.append(im)
                self.Nclasses += 1

            except:
                pass

        # - Generate poisson input and targets for classes
        self.input_raster = []
        self.target_raster = []
        for class_index in range(self.Nclasses):
            # - Generate output target raster for this class
            this_target = self.encode(self.images[class_index])
            self.target_raster.append(this_target)

            # - Generate poisson input raster for this class
            self.input_raster.append(
                np.random.rand(this_target.shape[0], num_input_channels) < poisson_rate
            )

        self.Nout = self.target_raster[-1].shape[1]

    def __getitem__(self, index):
        return self.input_raster[index], self.target_raster[index]

    def __len__(self):
        return self.Nclasses

    def quantize(self, image: np.ndarray) -> np.ndarray:
        im_quant = None

        if image.ndim == 2:
            # - Quantise down to `num_output_channels`
            num_levels = 2**num_output_channels_per_pixel
            im_quant = np.round(image * num_levels).astype("uint8")
            im_quant = np.unpackbits(im_quant, axis=2, bitorder="little")
            im_quant = im_quant[:, :, :num_output_channels]

        elif image.ndim == 3:
            # - Quanitise each RGB channel
            channels_per_RGB = int(np.floor((self.num_output_channels_per_pixel / 3)))
            num_levels = 2**channels_per_RGB - 1
            image = np.round(image * num_levels).astype("uint8")

            im_quant = []
            for ch in range(3):
                this_ch = np.unpackbits(
                    image[:, :, ch : ch + 1], axis=2, bitorder="little"
                )
                im_quant.append(this_ch[:, :, :channels_per_RGB])

            im_quant = np.concatenate(im_quant, axis=2)

        return im_quant

    def encode(self, image):
        target = np.expand_dims(self.quantize(image), axis=1)
        target = np.repeat(target, self.time_steps_per_pixel, axis=1)
        target = np.reshape(target, (image.shape[0] * self.time_steps_per_pixel, -1))
        return target

    def decode(self, output, class_index):
        output = np.reshape(
            output,
            (
                self.images[class_index].shape[0],
                self.time_steps_per_pixel,
                self.images[class_index].shape[1],
                -1,
            ),
        )
        output = np.mean(output, axis=1)
        return output
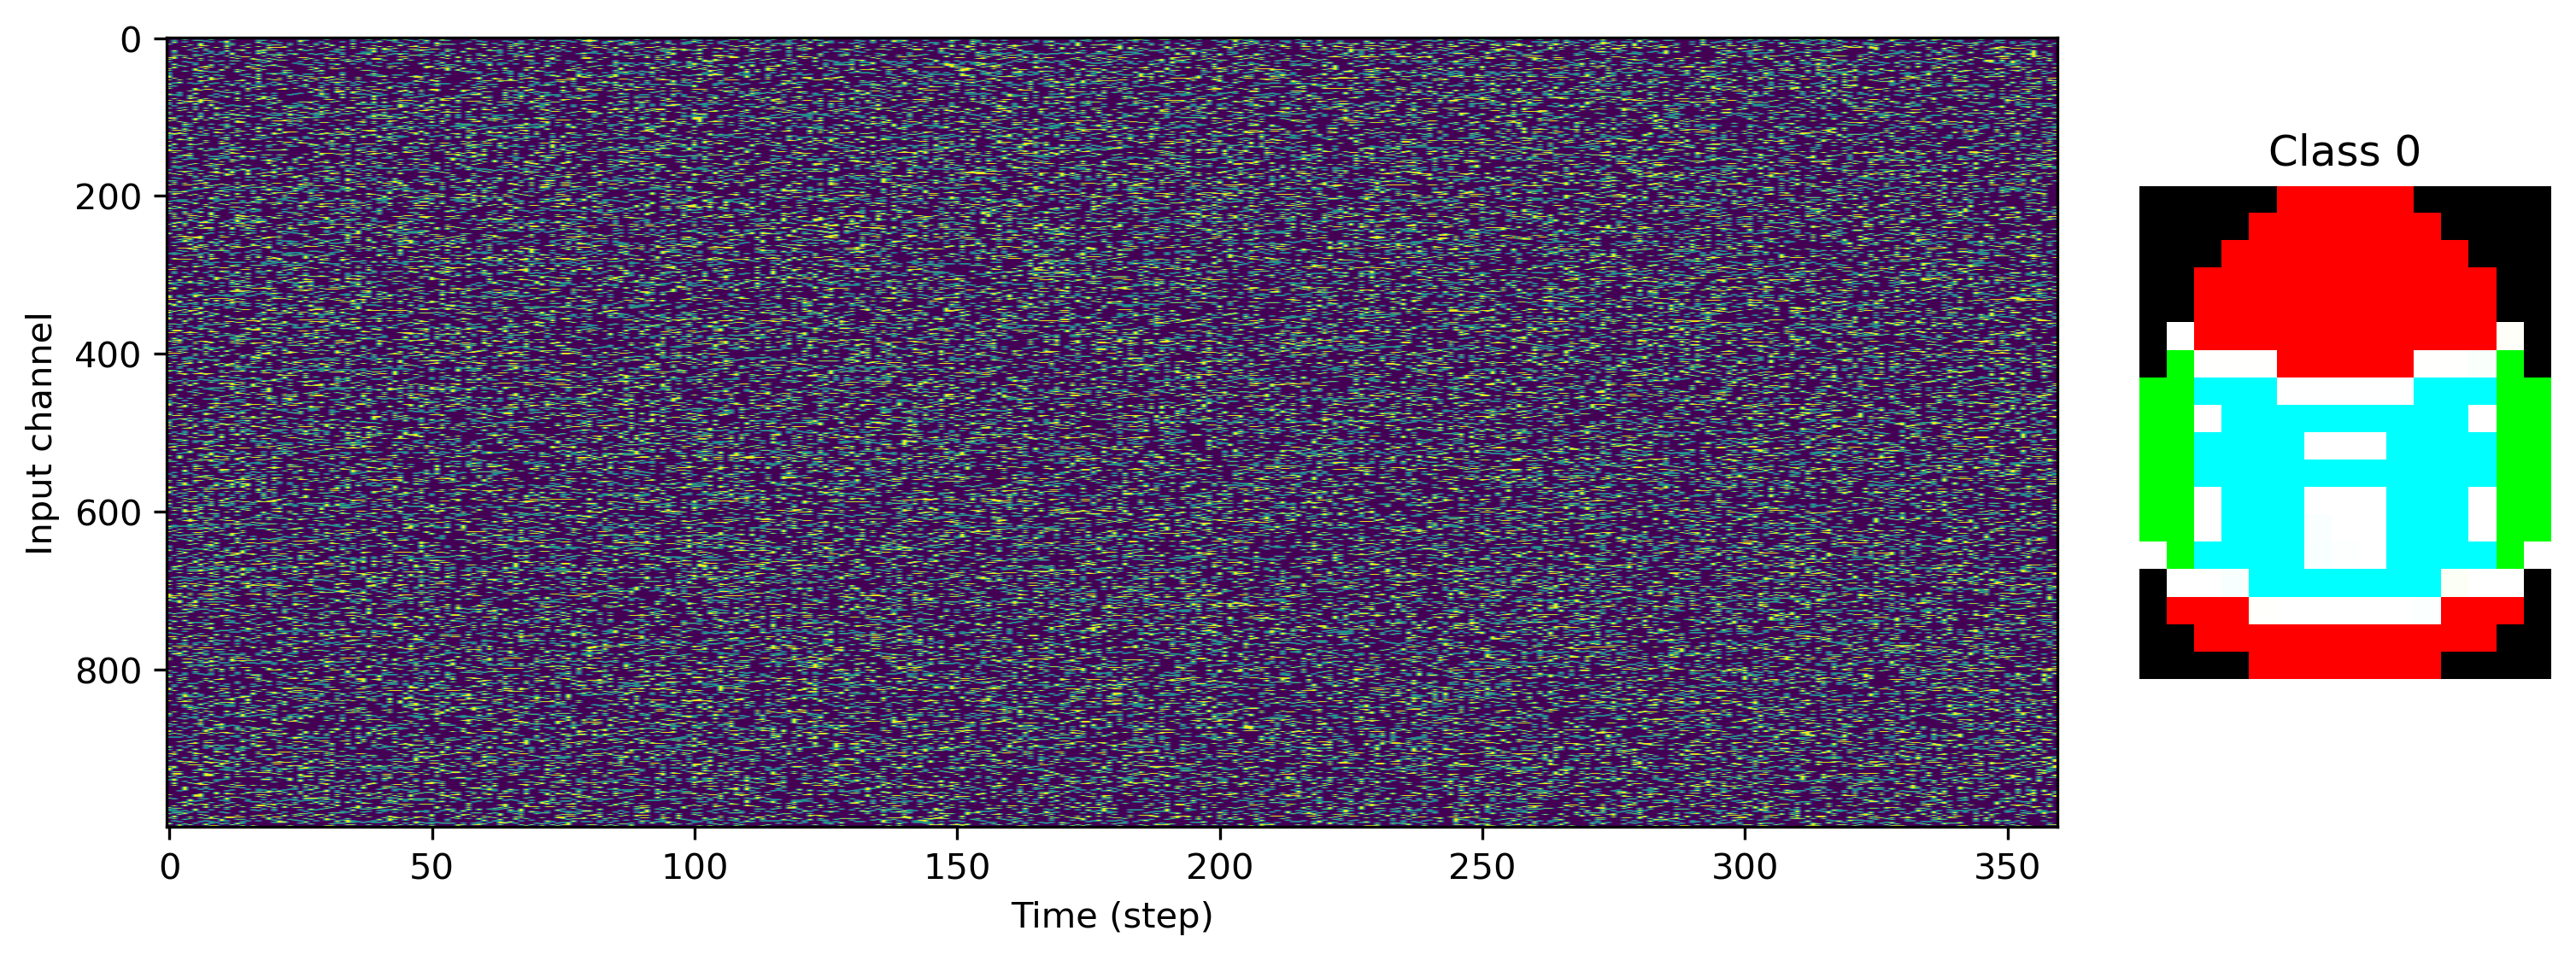
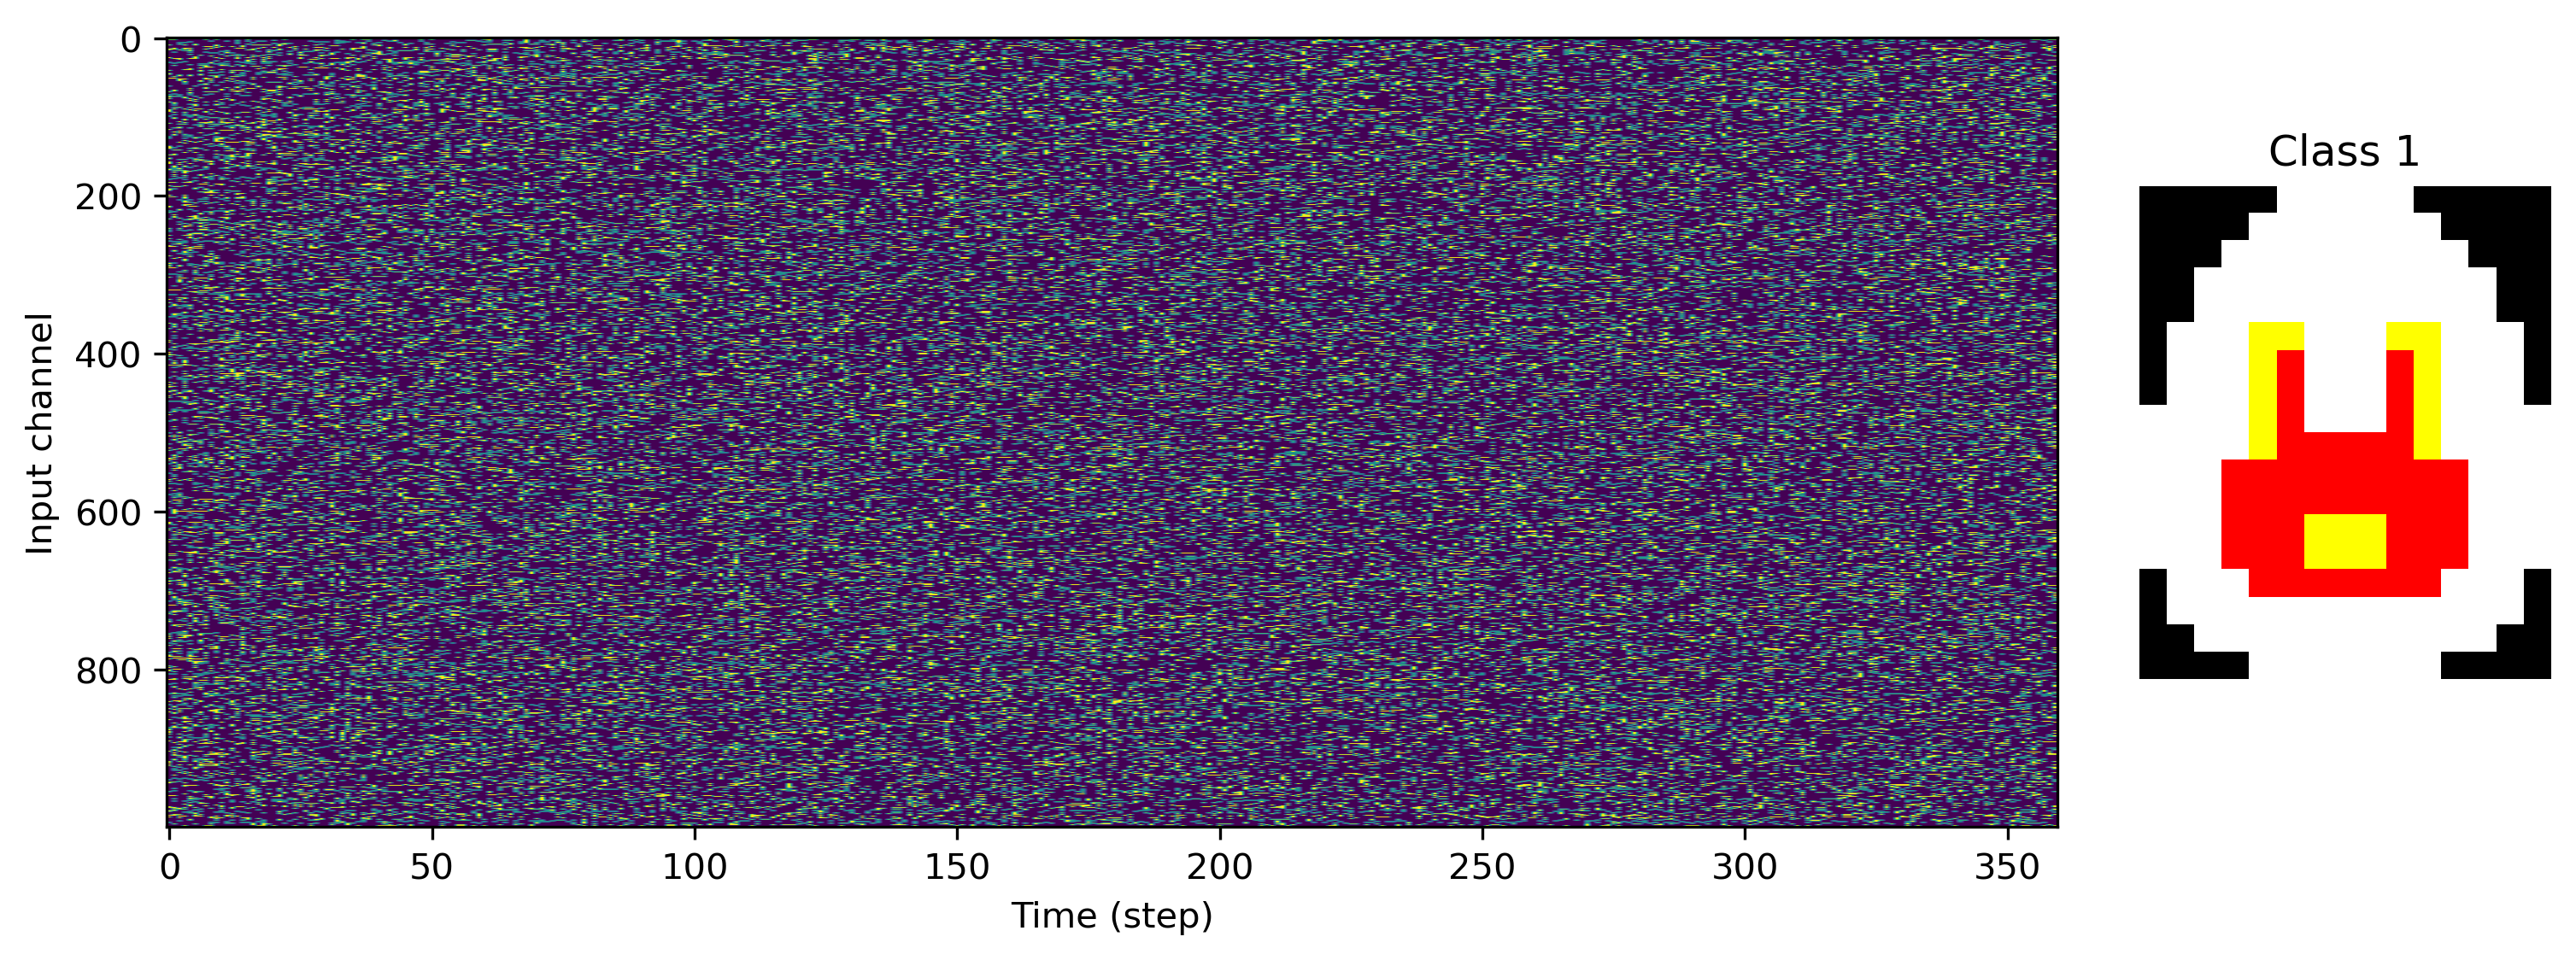
Now we can load some image files and generate a task and dataset. We’ll use 1000 input channels, and a single R, G and B output channel per pixel column.
[4]:
# - Task configuration
Nin = 1000
Nout_per_pix = 3
input_scale = 1.0

# - Load a data set and visualise
ds = PoissonToImages(
    [
        "egg-1.png",
        "egg-2.png",
        "egg-3.png",
    ],
    Nin,
    Nout_per_pix,
)
print(f"Dataset: Loaded {len(ds)} images.")

for class_index in range(len(ds)):
    plt.figure()
    plt.subplot(1, 5, (1, 4))
    plt.imshow(ds.input_raster[class_index].T, aspect="auto")
    plt.xlabel("Time (step)")
    plt.ylabel("Input channel")

    plt.subplot(1, 5, 5)
    plt.imshow(ds.images[class_index].astype("float"))
    plt.axis("off")
    plt.title(f"Class {class_index}")
Dataset: Loaded 3 images.
We can also see exactly what the desired output of the network is, with image rows stretched along time, and RGB channels interleaved.
[5]:
for class_index in range(len(ds)):
    plt.figure()
    plt.subplot(1, 5, (1, 4))
    plt.imshow(ds.target_raster[class_index].T, aspect="auto")
    plt.xlabel("Time (step)")
    plt.ylabel("Output channel")

    plt.subplot(1, 5, 5)
    plt.imshow(ds.images[class_index].astype("float"))
    plt.axis("off")
    plt.title(f"Class {class_index}")
Now we need a network to train for this task. We’ll use a simple feed-forward architecture with one hidden layer.
[6]:
Image("network-01.png", width=200)
[6]:
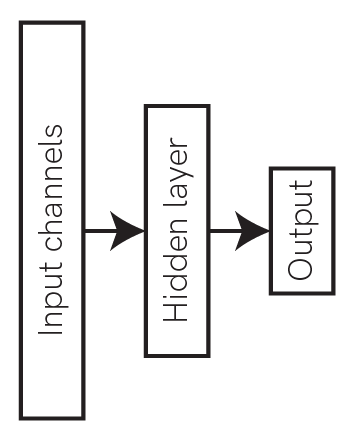
We’ll use spiking linear integrate-and-fire (LIF) neurons for the hidden and output layers, using the Jax backend of Rockpool and the module LIFJax. This module provides a gradient-descent trainable layer of neurons, using Jax to optimise the neuron parameters. The weights in between the layers will use the LinearJax module, which is likewise trainable.
Let’s pick 100 neurons for the hidden layer in this network.
[7]:
# - Network configuration
Nin = ds.Nin
Nhidden = 100
Nout = ds.Nout

# - Rockpool modules
from rockpool.nn.modules import LIFJax, LinearJax
from rockpool.nn.modules.jax.jax_lif_ode import LIFODEJax
from rockpool.nn.combinators import Sequential
from rockpool.training import jax_loss as jl
from rockpool.parameters import Constant

bias_hidden = np.ones(Nhidden)
bias_out = np.ones(Nout)

net = Sequential(
    LinearJax((Nin, Nhidden), has_bias=False),
    LIFODEJax((Nhidden), bias=bias_hidden, threshold=Constant(1.0)),
    LinearJax((Nhidden, Nout), has_bias=False),
    LIFODEJax((Nout), bias=bias_out, threshold=Constant(1.0)),
)
print(net)
2022-11-21 16:26:39.494467: W external/org_tensorflow/tensorflow/compiler/xla/service/platform_util.cc:198] unable to create StreamExecutor for CUDA:0: failed initializing StreamExecutor for CUDA device ordinal 0: INTERNAL: failed call to cuDevicePrimaryCtxRetain: CUDA_ERROR_OUT_OF_MEMORY: out of memory; total memory reported: 25431310336
WARNING:jax._src.lib.xla_bridge:No GPU/TPU found, falling back to CPU. (Set TF_CPP_MIN_LOG_LEVEL=0 and rerun for more info.)
JaxSequential  with shape (1000, 45) {
    LinearJax '0_LinearJax' with shape (1000, 100)
    LIFODEJax '1_LIFODEJax' with shape (100, 100)
    LinearJax '2_LinearJax' with shape (100, 45)
    LIFODEJax '3_LIFODEJax' with shape (45, 45)
}
Now we can import Jax and build a simple loss function, which will be the MSE between the network output and the desired target. We use jax.jit to compile the optimiser update function as well as the loss function — these will be automatically targeted to CPU, GPU or TPU by Jax, depending on what’s available. We use jax.value_and_grad to automatically differentiate the loss function over the network parameters
[8]:
# - Import the bounds convenience functions
from rockpool.training.jax_loss import bounds_cost, make_bounds

# - Generate a set of pre-configured bounds
lower_bounds, upper_bounds = make_bounds(net.parameters())
print("lower_bounds: ", lower_bounds, "upper_bounds: ", upper_bounds)
lower_bounds: {'0_LinearJax': {'weight': -inf}, '1_LIFODEJax': {'bias': -inf, 'tau_mem': -inf, 'tau_syn': -inf}, '2_LinearJax': {'weight': -inf}, '3_LIFODEJax': {'bias': -inf, 'tau_mem': -inf, 'tau_syn': -inf}} upper_bounds: {'0_LinearJax': {'weight': inf}, '1_LIFODEJax': {'bias': inf, 'tau_mem': inf, 'tau_syn': inf}, '2_LinearJax': {'weight': inf}, '3_LIFODEJax': {'bias': inf, 'tau_mem': inf, 'tau_syn': inf}}
[9]:
dt = 1e-3
lower_bounds["1_LIFODEJax"]["tau_mem"] = 11 * dt
lower_bounds["1_LIFODEJax"]["tau_syn"] = 11 * dt
lower_bounds["3_LIFODEJax"]["tau_mem"] = 11 * dt
lower_bounds["3_LIFODEJax"]["tau_syn"] = 11 * dt

if "threshold" in lower_bounds["1_LIFODEJax"]:
    lower_bounds["1_LIFODEJax"]["threshold"] = 0.1
    lower_bounds["3_LIFODEJax"]["threshold"] = 0.1
[10]:
# - Jax imports
import jax
from jax.example_libraries.optimizers import adam
from itertools import count

# - Initialise optimiser
learning_rate = 1e-4
bounds_penalty = 10.0
init_fun, update_fun, get_params = adam(learning_rate)
opt_state = init_fun(net.parameters())
update_fun = jax.jit(update_fun)

# - Loss function
@jax.jit
@jax.value_and_grad
def loss_vgf(params, net, input, target):
    net = net.set_attributes(params)
    net = net.reset_state()
    output, _, _ = net(input)

    # - Impose the bounds
    bounds = bounds_cost(params, lower_bounds, upper_bounds)

    return jl.mse(output, target) + bounds_penalty * bounds
Now we can specify the number of epochs to train for, and use a simple training loop to perform gradient descent learning. We’ll keep track of the loss values along the way to visualise.
[11]:
# - Compose samples into batches
batch_input = []
batch_target = []
for this_input, this_target in ds:
    batch_input.append(this_input)
    batch_target.append(this_target)

batch_input = np.stack(batch_input)
batch_target = np.stack(batch_target)
[12]:
# - Configure learning
num_epochs = 35000

# - Training loop
loss_t = []
sample_index = count()
t = trange(num_epochs, desc="Training", unit="Epoch")

for epoch in t:
    # - Get parameters
    opt_parameters = get_params(opt_state)

    # - Compute loss and gradient
    l, g = loss_vgf(opt_parameters, net, batch_input * input_scale, batch_target)
    if l > bounds_penalty:
        l = l % bounds_penalty
    loss_t.append(l)
    t.set_postfix({"loss": l.item()}, refresh=False)

    # - Update optimiser
    opt_state = update_fun(next(sample_index), g, opt_state)
[13]:
plt.plot(loss_t)
plt.yscale("log")
plt.xlabel("Sample")
plt.ylabel("Loss value")
plt.title("Training loss");
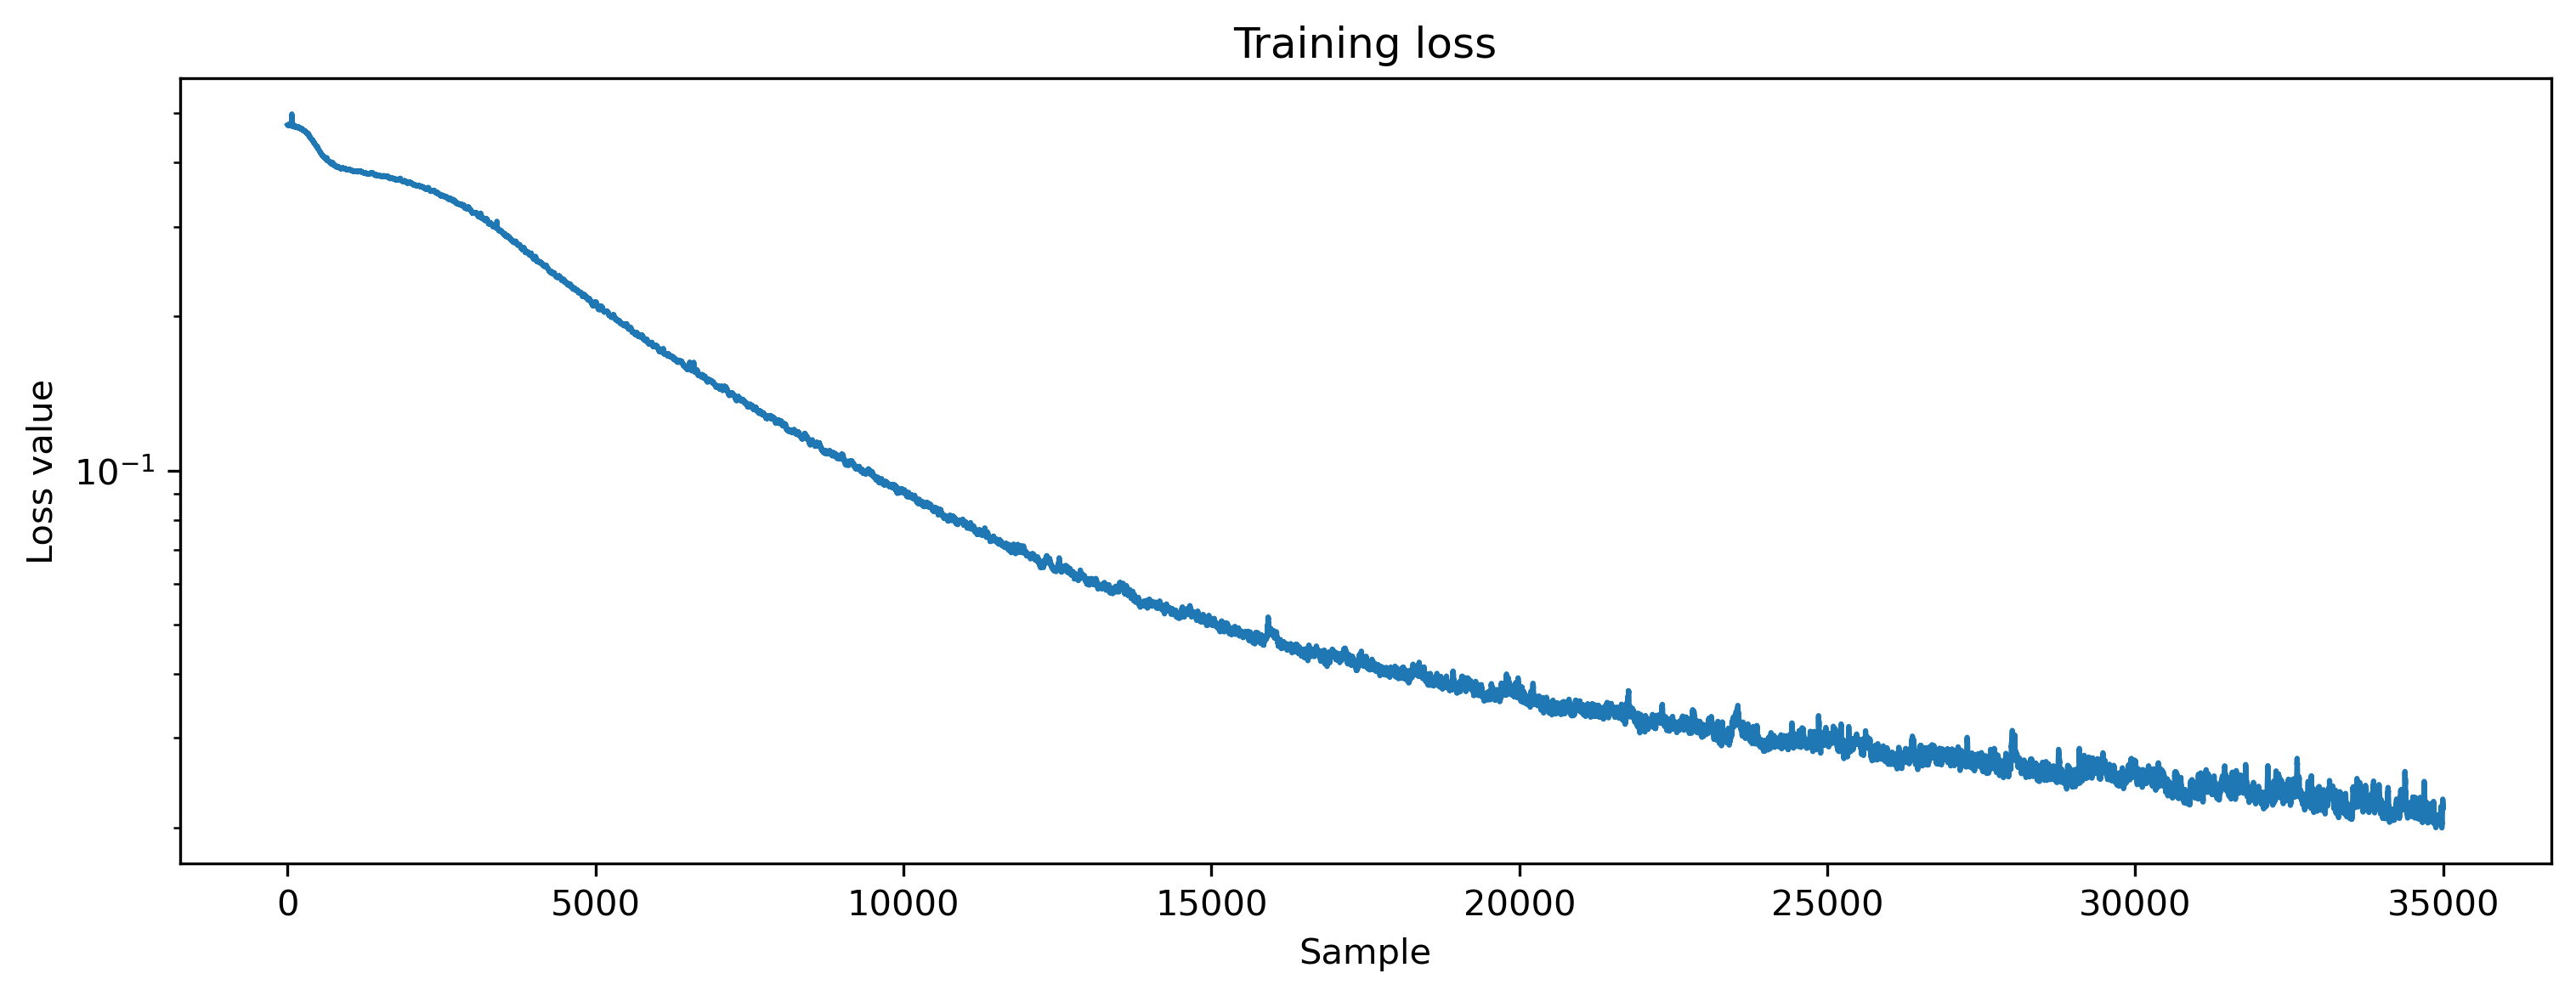
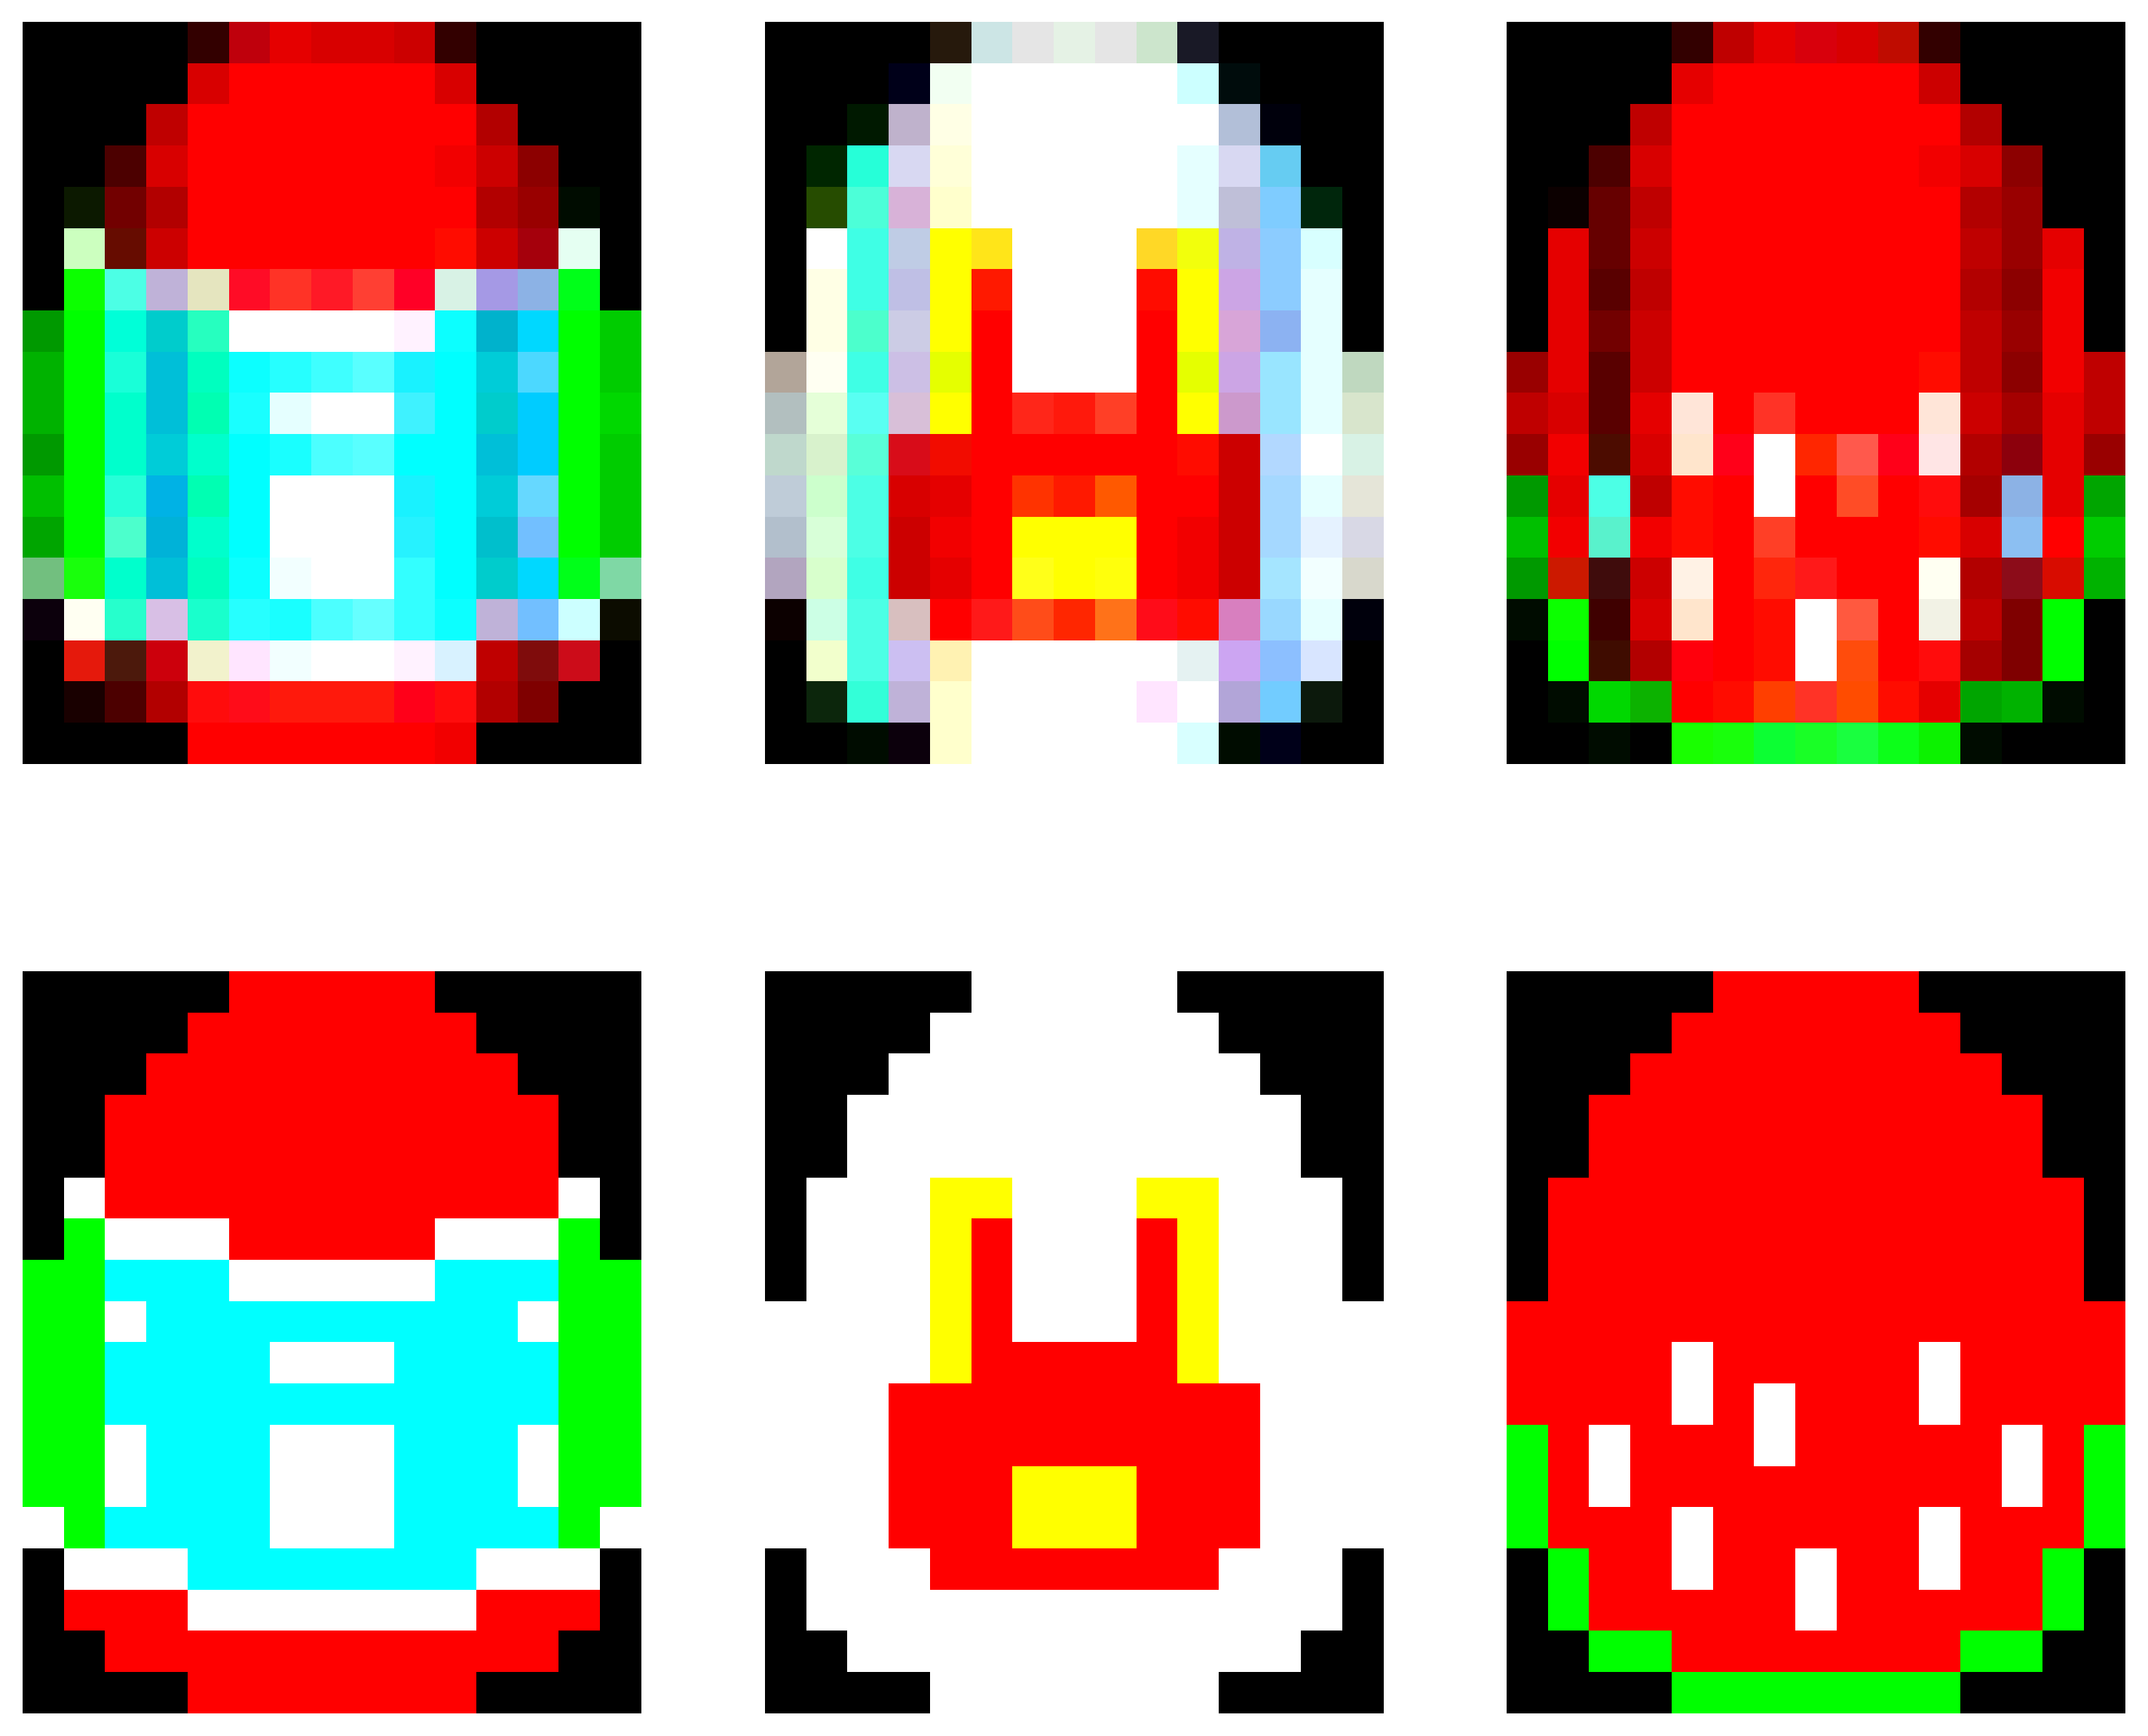
The loss decreased, indicating that the network is learning to produce the desired output. Let’s visualise the output of the network over the various classes to check.
[14]:
# - Test training
net = net.set_attributes(get_params(opt_state))

plt.figure(figsize=(12, 10))

for class_index in range(len(ds)):
    inp, target = ds[class_index]
    out, _, rec_state = net(inp * input_scale)

    plt.subplot(2, 3, 1 + class_index)
    plt.imshow(ds.decode(out, class_index))
    plt.axis("off")

    plt.subplot(2, 3, 4 + class_index)
    plt.imshow(ds.decode(target, class_index))
    plt.axis("off")
    plt.axis("off")
WARNING:matplotlib.image:Clipping input data to the valid range for imshow with RGB data ([0..1] for floats or [0..255] for integers).
WARNING:matplotlib.image:Clipping input data to the valid range for imshow with RGB data ([0..1] for floats or [0..255] for integers).
WARNING:matplotlib.image:Clipping input data to the valid range for imshow with RGB data ([0..1] for floats or [0..255] for integers).
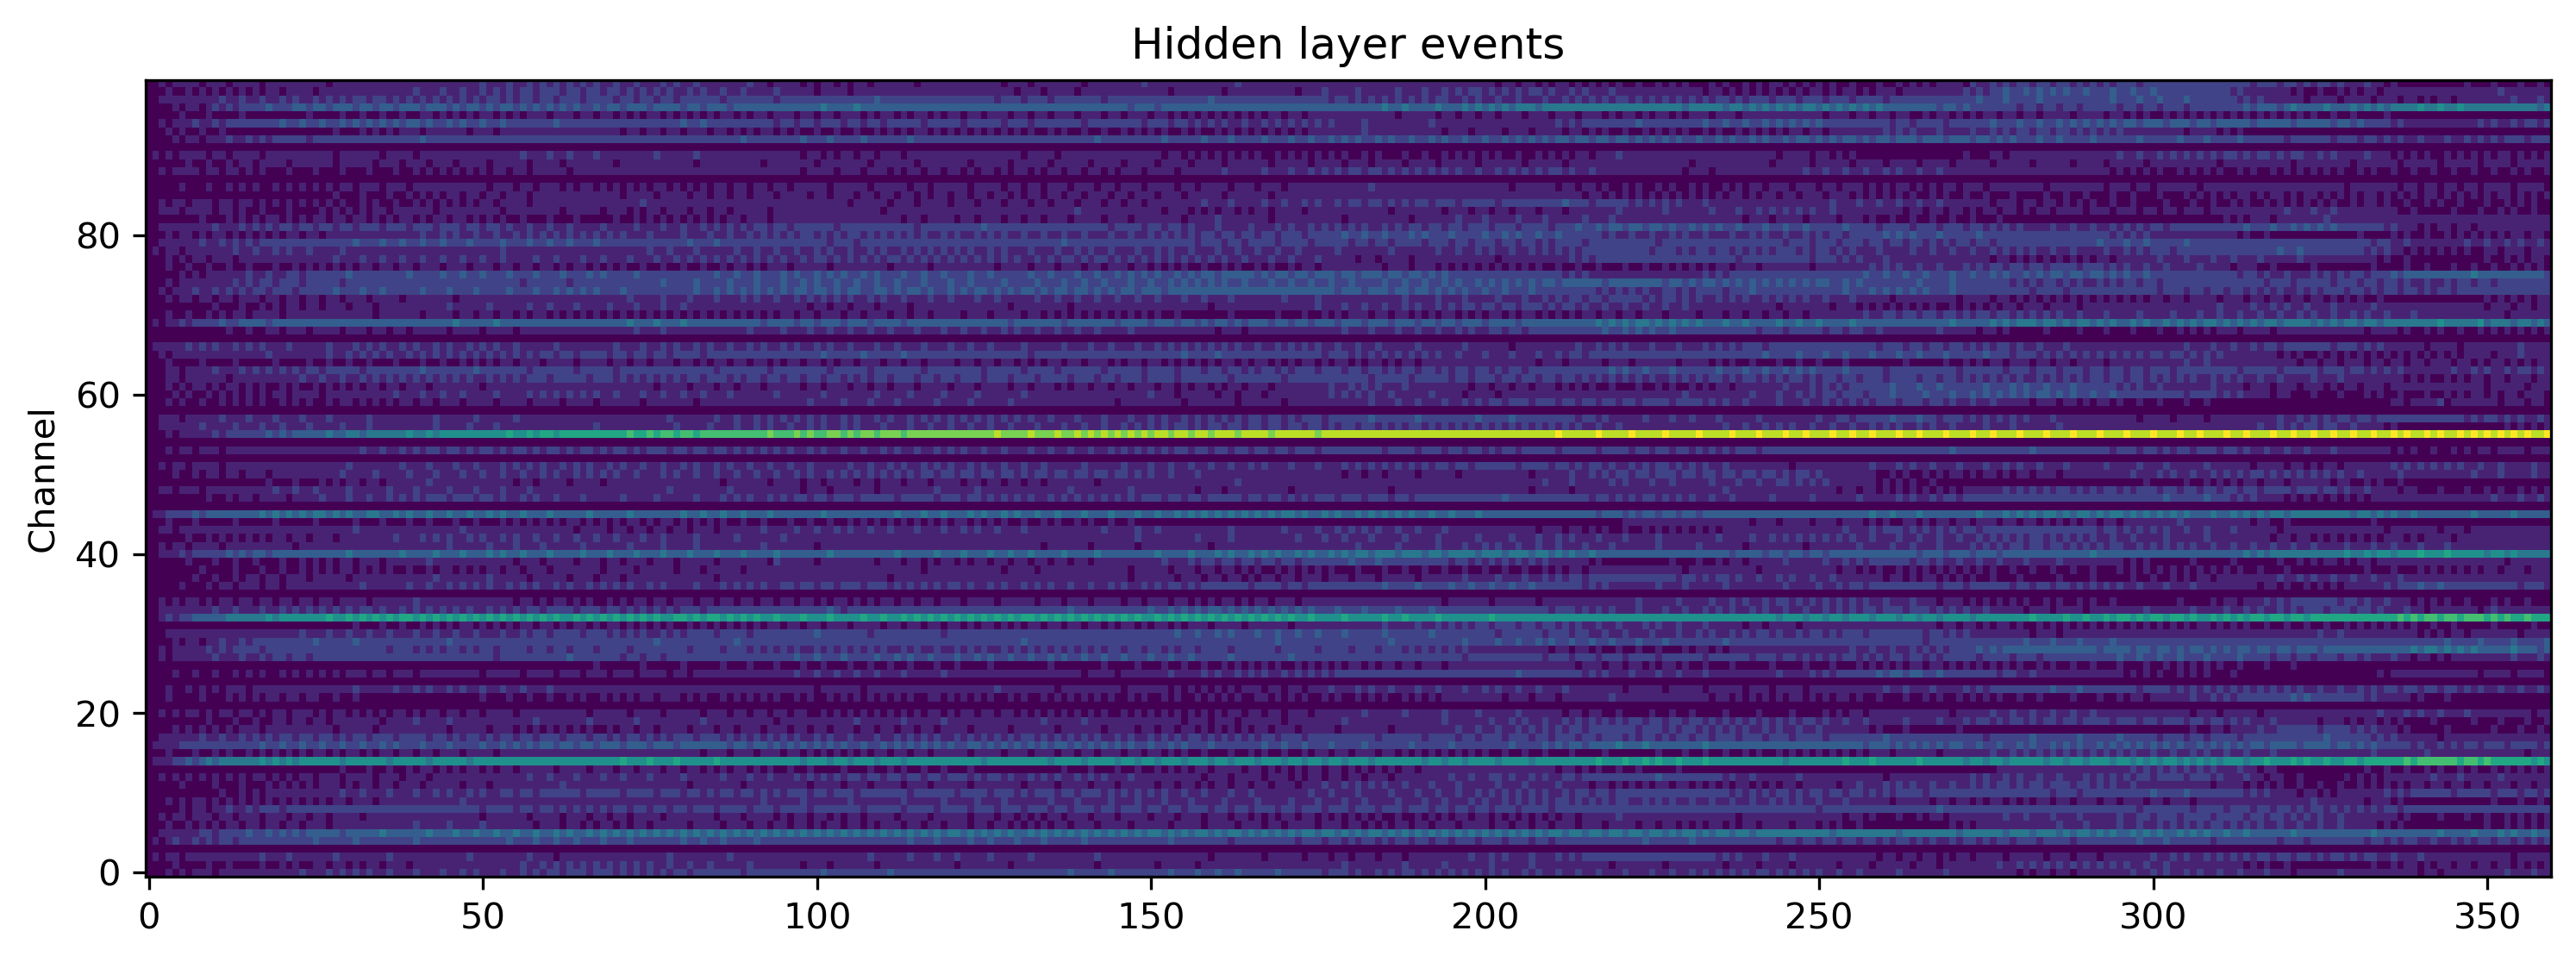
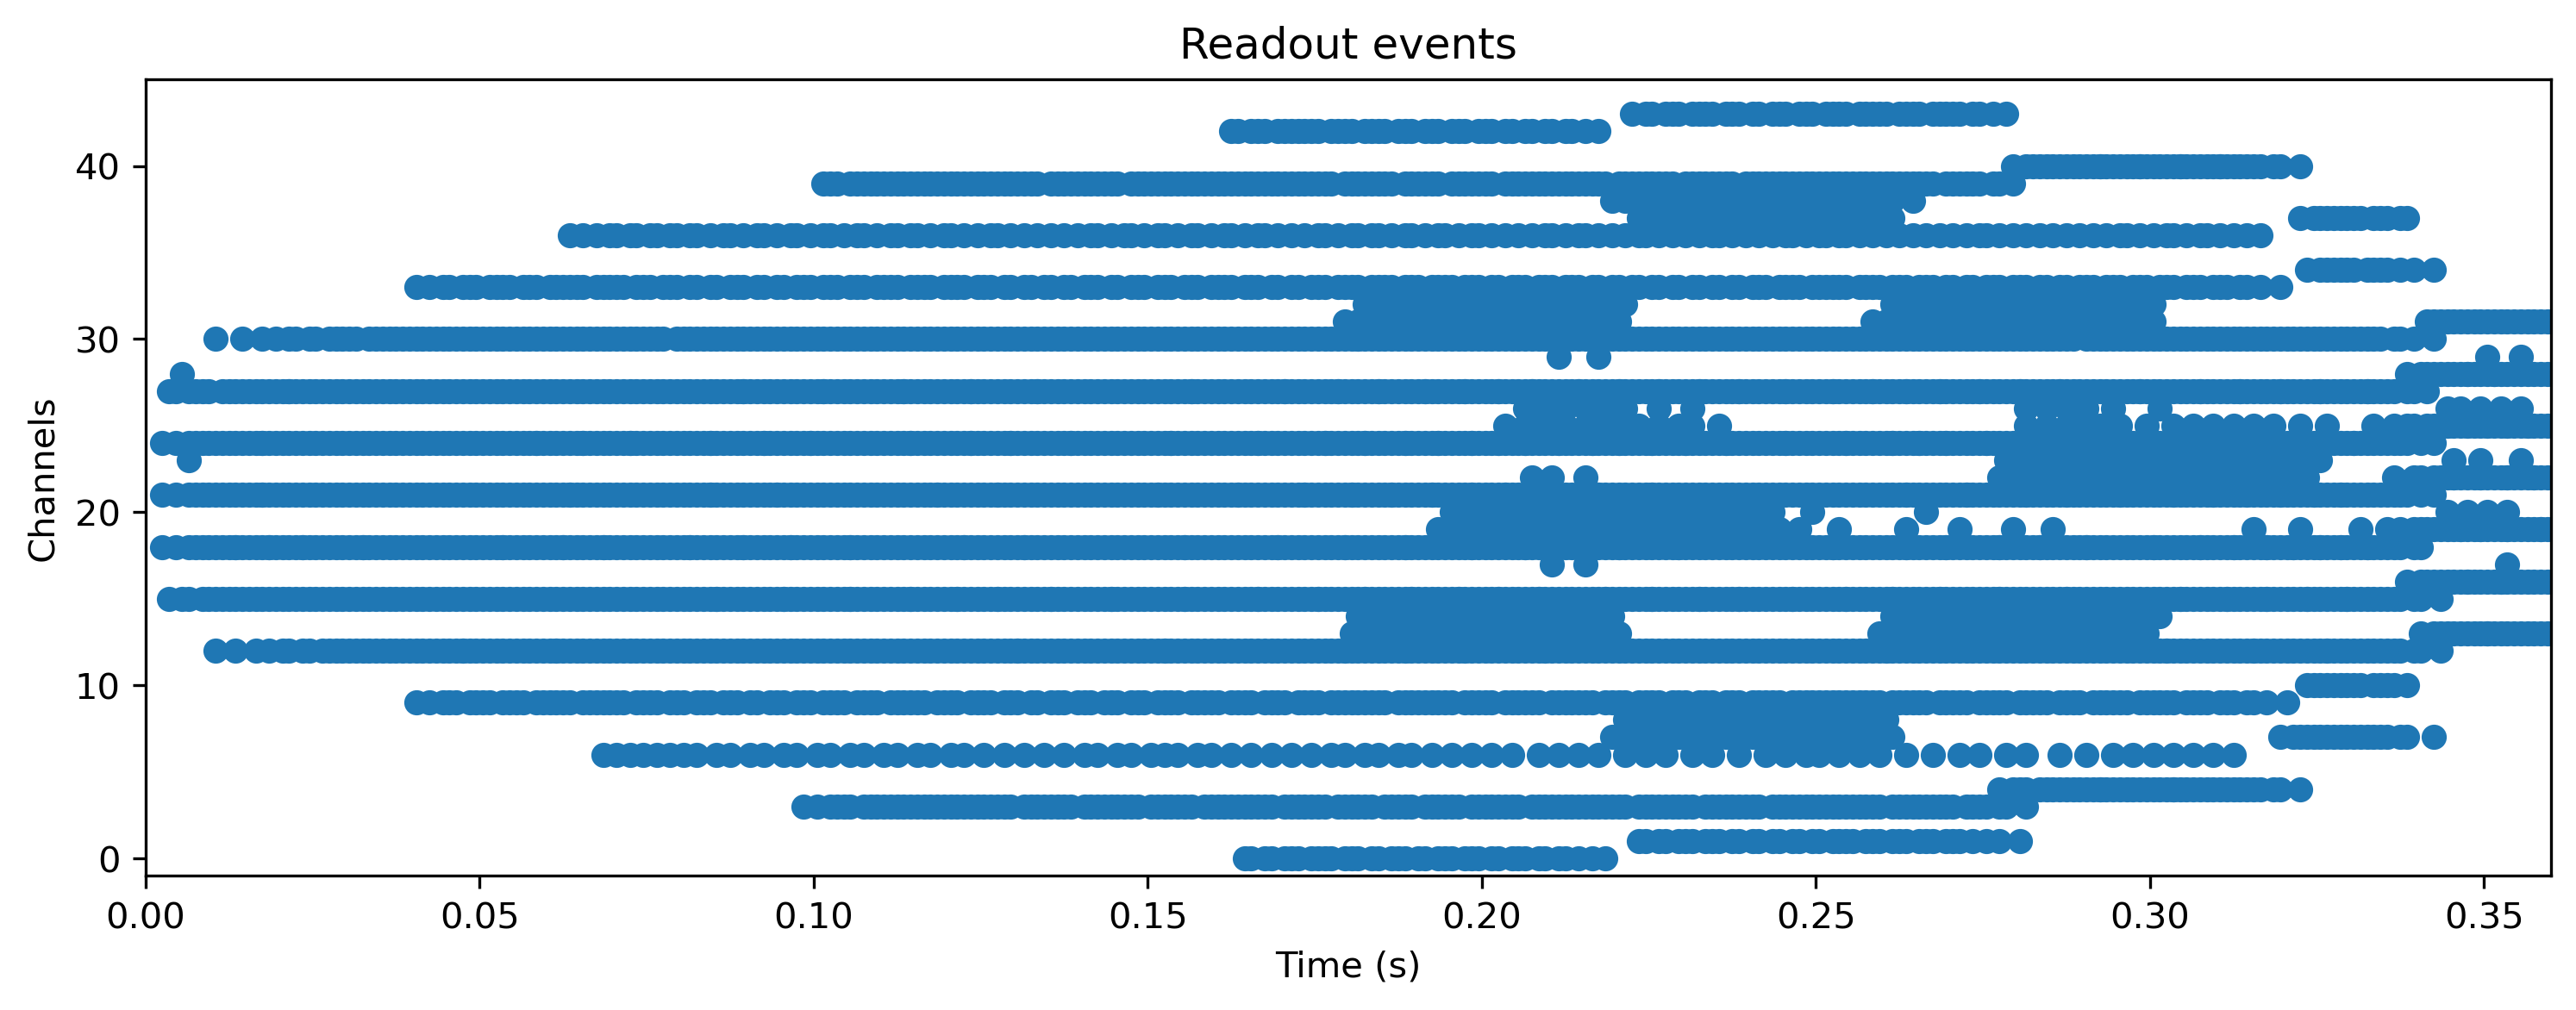
But what is the network doing internally? Let’s take a look at the spiking activity of the hidden and output layers.
[15]:
plt.figure()
# TSEvent.from_raster(rec_state['1_LIFODEJax_output'][0], dt = 1e-3).plot();
plt.imshow(rec_state["1_LIFODEJax_output"][0].T, aspect="auto", origin="lower")
plt.title("Hidden layer events")
plt.ylabel("Channel")

plt.figure()
TSEvent.from_raster(rec_state["3_LIFODEJax_output"][0], dt=1e-3).plot()
plt.title("Readout events");
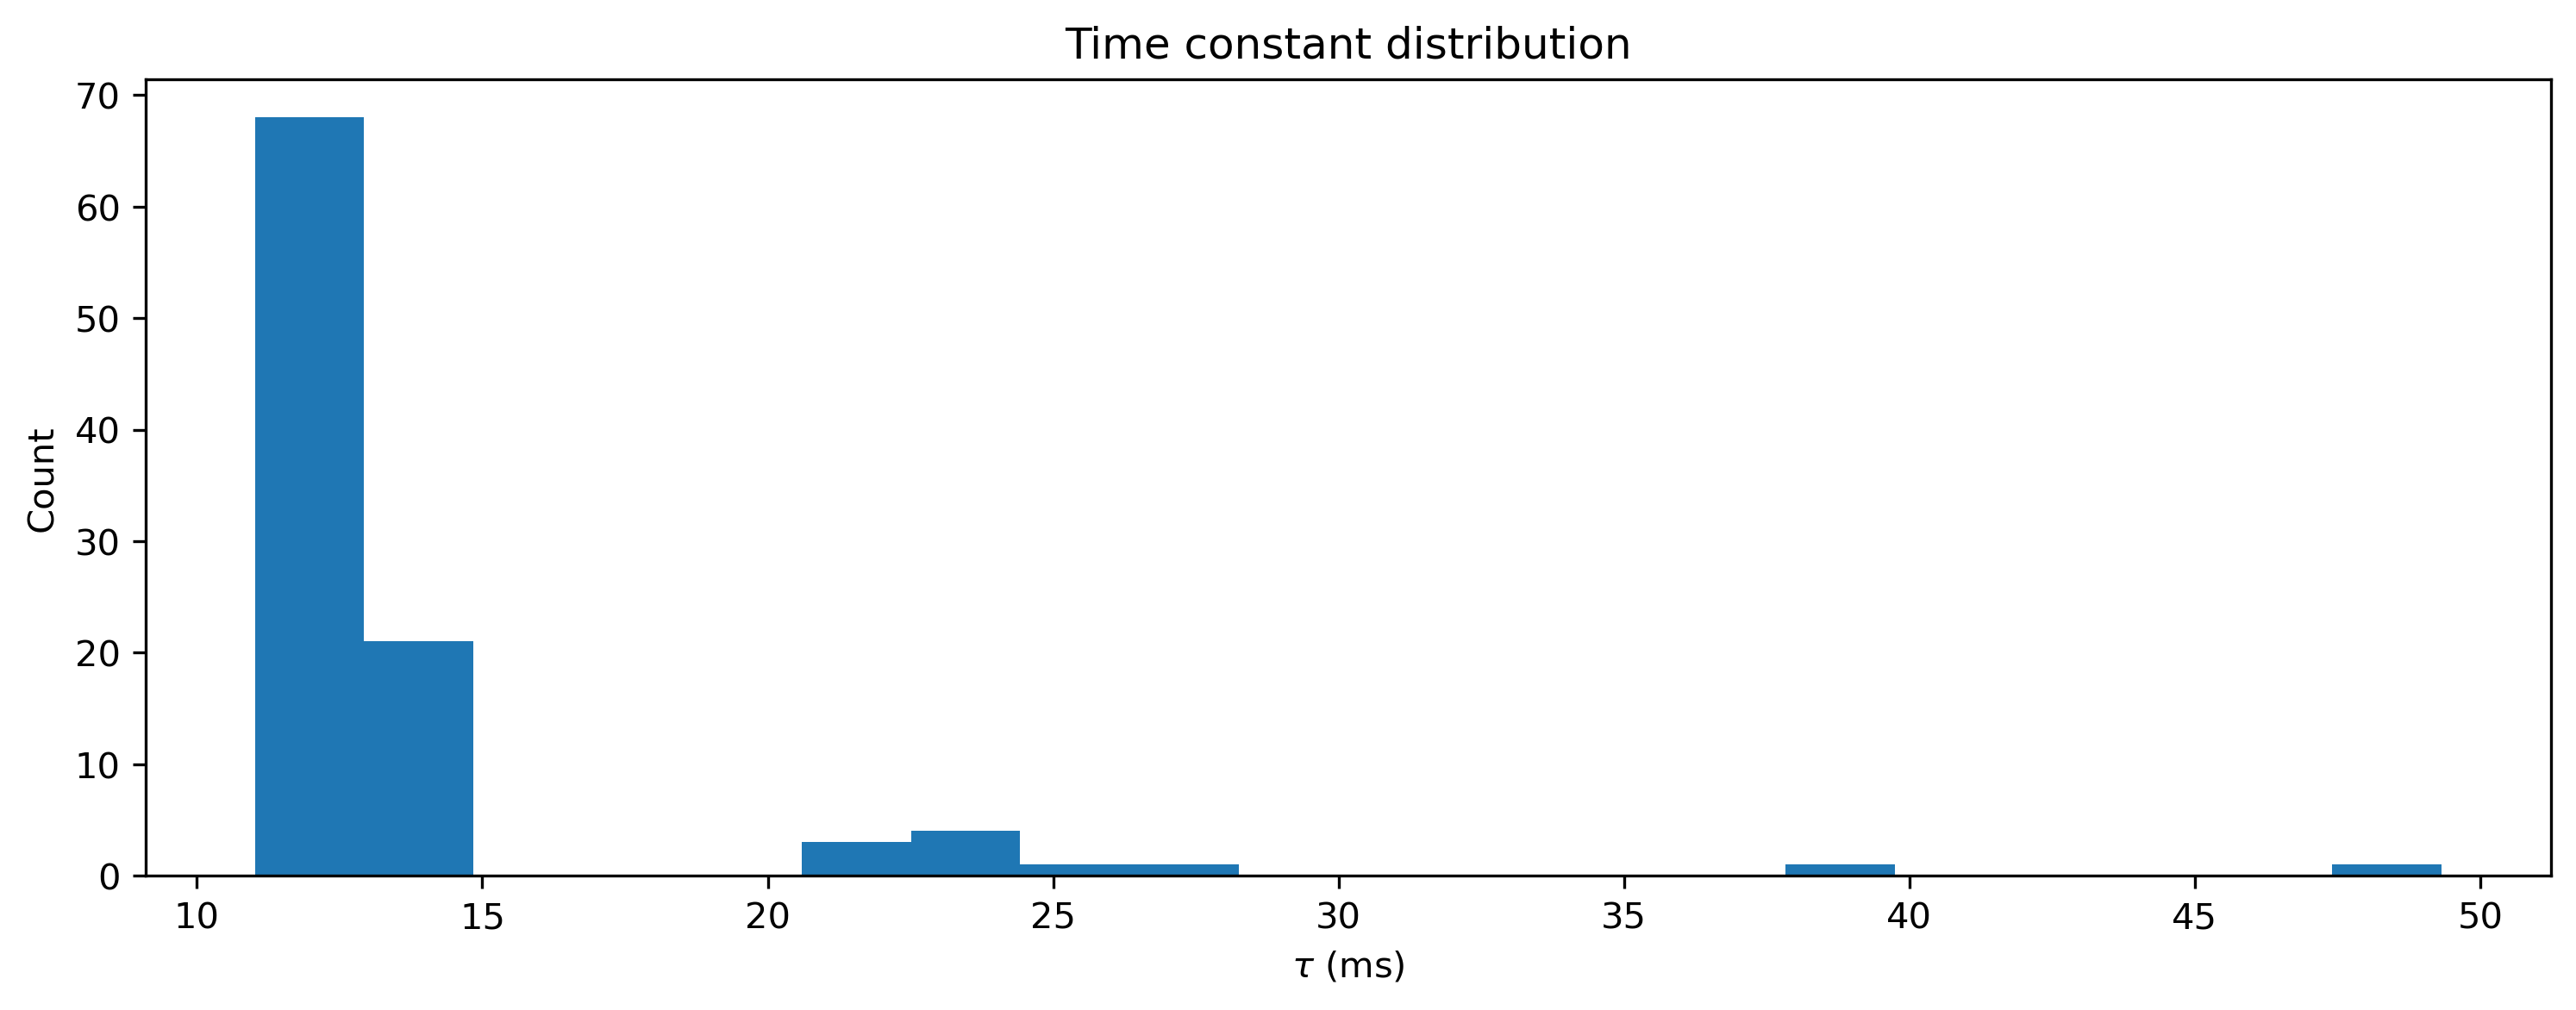
This toolchain lets you train all neuron parameters, not only weights and biases. Let’s take a look at the final distribution of time constants, which were initially identical.
[16]:
plt.hist(net[1].tau_mem * 1e3, 20)
plt.xlabel("$\\tau$ (ms)")
plt.ylabel("Count")
plt.title("Time constant distribution");
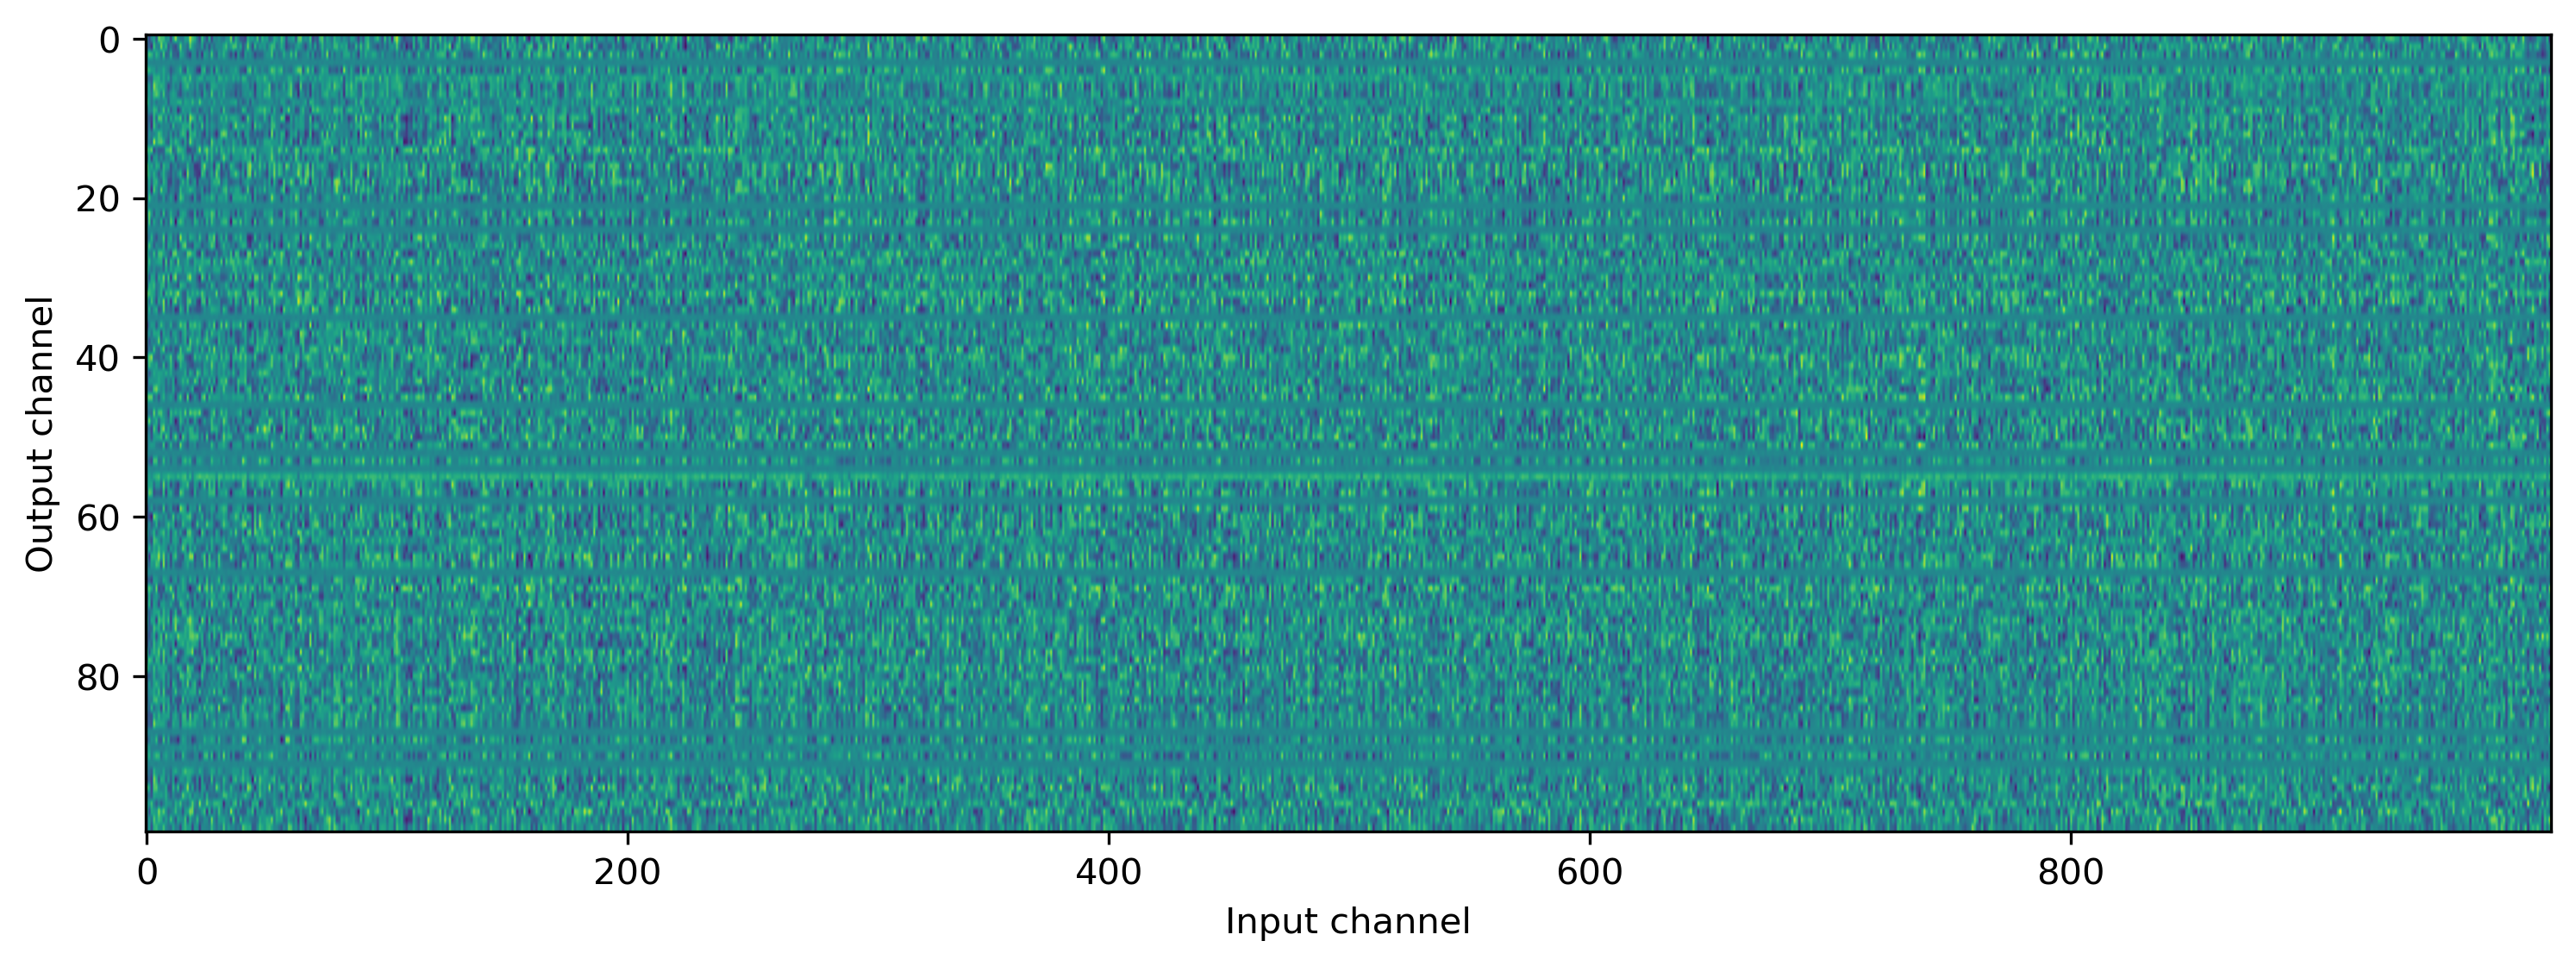
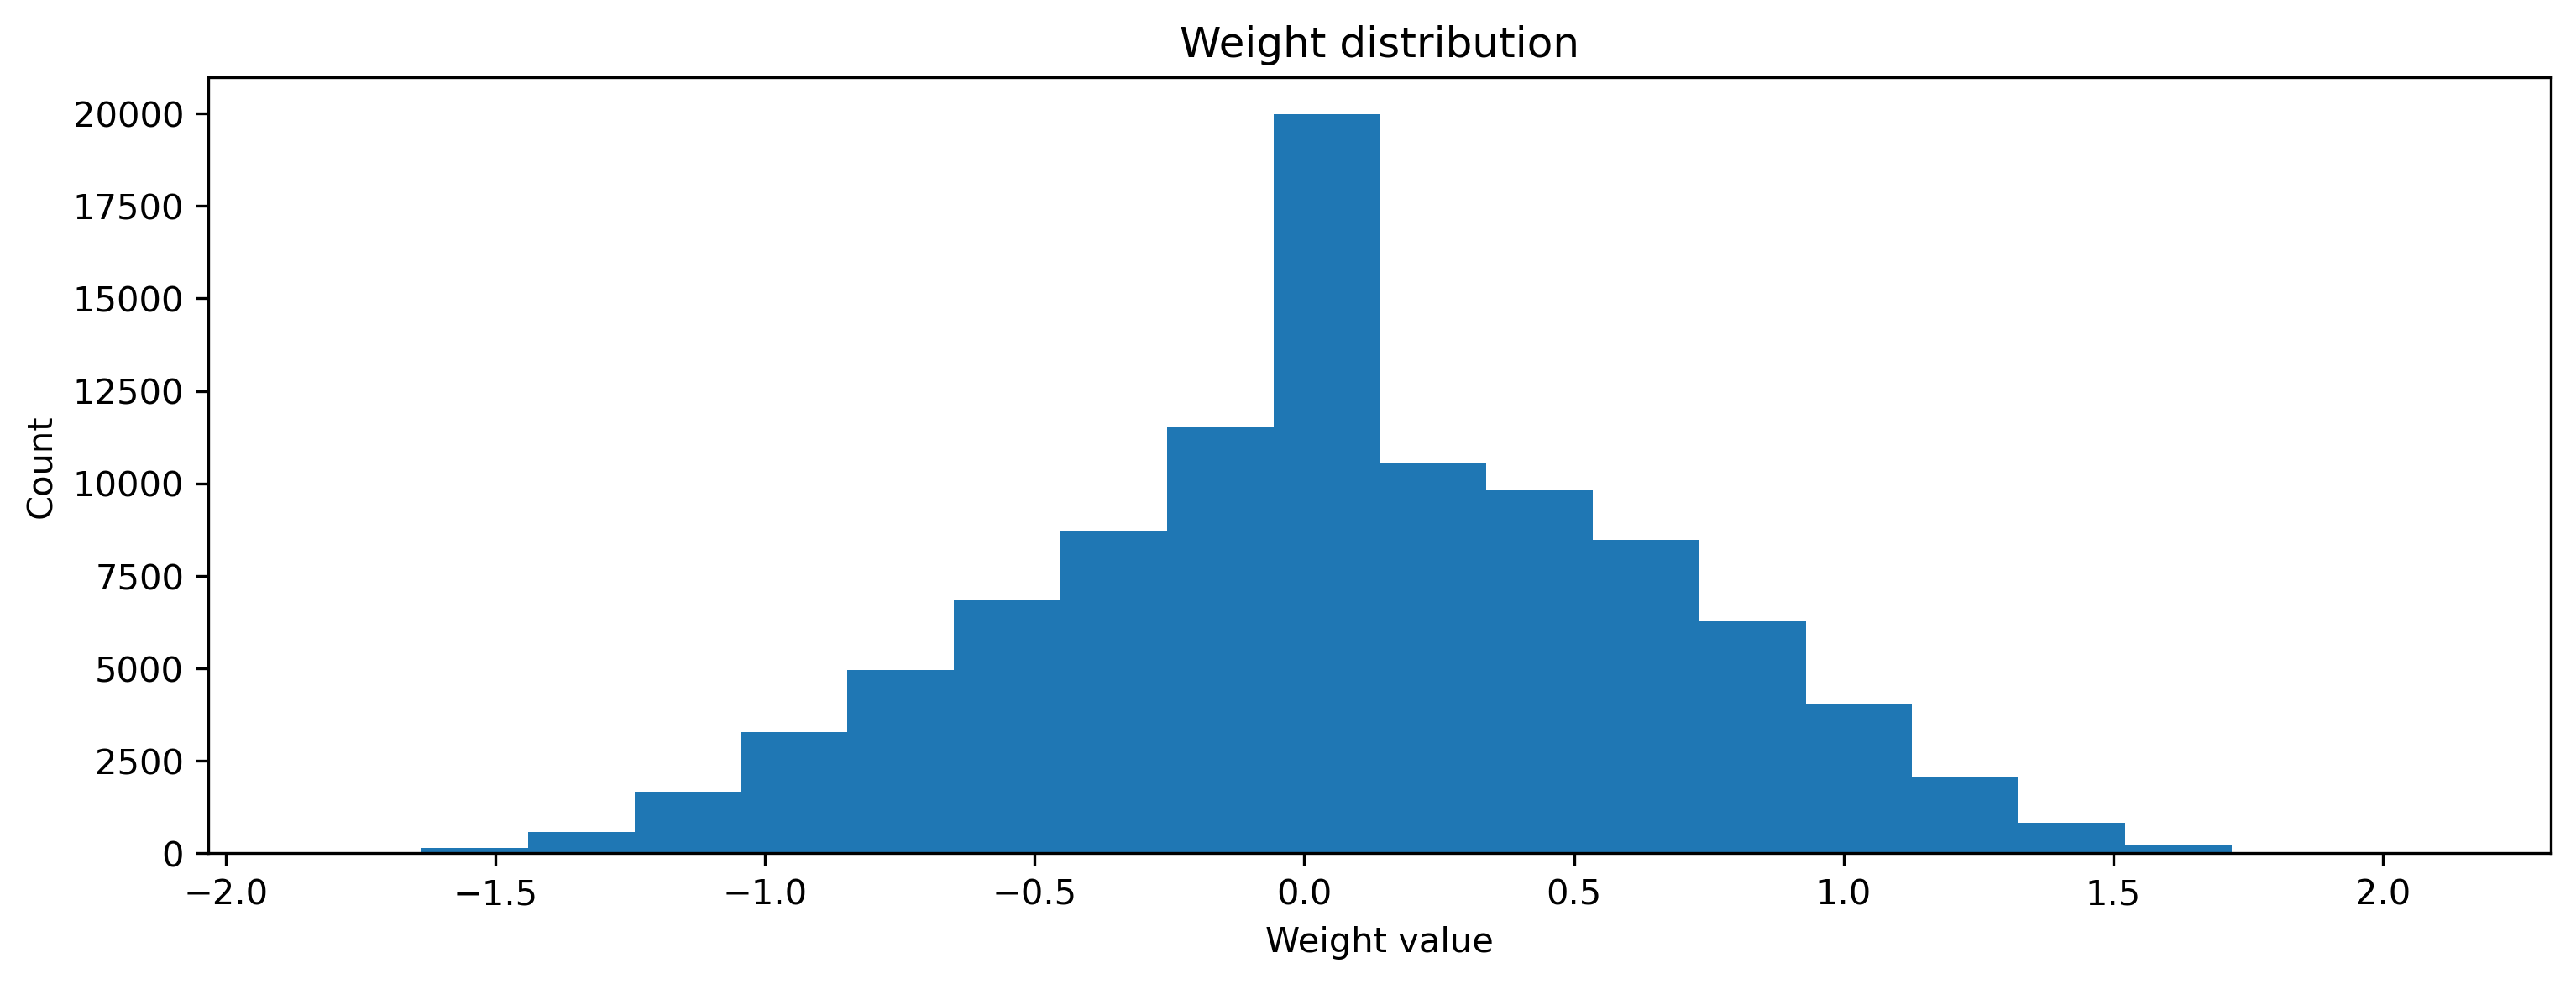
And of course the weights have also been learned to perform the task correctly.
[17]:
plt.hist(np.ravel(net[0].weight), 20)
plt.xlabel("Weight value")
plt.ylabel("Count")
plt.title("Weight distribution");
[18]:
plt.imshow(net[0].weight.T, aspect="auto")
plt.xlabel("Input channel")
plt.ylabel("Output channel");
